Featured Post

Welcome to the Forensic Multimedia Analysis blog (formerly the Forensic Photoshop blog). With the latest developments in the analysis of m...

Showing posts sorted by relevance for query statistics. Sort by date Show all posts

Friday, August 30, 2019

Yes, you do need stats ... actually

Yesterday, I received the good news that my validation study of how a course in statistics could improve the statistical literacy of digital / multimedia forensic analysts when delivered on-line as micro-learning was published by the Chartered Society of Forensic Science in the UK. I got excited and put the good news on my LinkedIn feed.
Along with the usual emoji responses, I received the comment shown below.
Rather than simply comment there, I'd like to take the opportunity to illustrate the many ways in which it's not just me who says that the world of the digital evidence analyst can benefit from a solid foundation in statistics.

You see, the course was created because the relevant government bodies around the world have said, on a rather regular basis, that the investigative services and the forensic sciences need a solid foundation in statistics.

Starting at the US government level, there's the PCAST Report from 2016 (link): "NIST has also taken steps to address this issue by creating a new Forensic Science Center of Excellence, called the Center for Statistics and Applications in Forensic Evidence (CSAFE), that will focus its research efforts on improving the statistical foundation for latent prints, ballistics, tiremarks, handwriting, bloodstain patterns, toolmarks, pattern evidence analyses, and for computer and information systems, mobile devices, network traffic, social media, and GPS digital evidence analyses." (emphasis is mine)

CSAFE has already responded with some tools for digital forensic analysts (link).  The ASSOCR tool will help analysts "determine if two temporal event streams are from the same source by through this R package that implements a score-based likelihood ratio and coincidental match probability methods."
The HEISENBRGR toolset can be used to "match accounts on anonymous marketplaces, to figure out which of them belong to the same sellers."
What about NIST? What is the issue that NIST is taking steps to address? The PCAST report notes, "The 2009 NRC report called for studies to test whether various forensic methods are foundationally valid, including performing empirical tests of the accuracy of the results. It also called for the creation of a new, independent Federal agency to provide needed oversight of the forensic science system; standardization of terminology used in reporting and testifying about the results of forensic sciences; the removal of public forensic laboratories from the administrative control of law enforcement agencies; implementation of mandatory certification requirements for practitioners and mandatory accreditation programs for laboratories; research on human observer bias and sources of human error in forensic examinations; the development of tools for advancing measurement, validation, reliability, and proficiency testing in forensic science; and the strengthening and development of graduate and continuous education and training programs."

It's that last bit that prompted me to design and validate an instructional program in statistics for forensic analysts. But, it's the first sentence that speaks to the comment from LinkedIn. Analysts don't deal in absolutes or definite - binary. The world of the computer program may be binary, but the world certainly isn't. There is a natural variability to be found everywhere. But more to the comment's point, how does an analyst know that their "various forensic methods are foundationally valid, including performing empirical tests of the accuracy of the results."

Ahh... but, you're saying, all of your support is from the United States. It doesn't apply to the rest of the world. In that, you're wrong. Let's look at the UK.

In September 2018, Members of the Royal Statistical Society Statistics & Law section (link) submitted evidence (link) to a House of Lords Science and Technology Committee inquiry on Forensic Science. Question 2 asked, "what are the current strengths and weaknesses of forensic science in support of justice?" Here's the RSS' response. Notice the imbalance between strengths and weaknesses.
I've highlighted the relevant section as it relates to this topic. "poor quality of probabilistic reasoning and statistical evidence, for example, providing irrelevant information because the correct question is not asked. For example, an expert focused on the rarity of an event, rather than considering two competing explanations of an event."

Our course on statistics for forensic analysts seeks to teach probabilistic reasoning, exploring the differences between objective and subjective statistics, as well as the fact that most of the forensic sciences currently work in the wold of abductive reasoning (taking your best shot).

Now there's the accusation that digital analysts are often engaged in "push button forensics." We buy tools from vendors and hope that they're fit for purpose and accurate in their results. But are they? We don't know, so we validate our tools (hopefully). If you're trusting the market to deliver reliable, valid, and accurate tools, you may be disappointed. As the above referenced report notes, "What can be learned from the use of forensic science overseas? Seen from continental Europe, there has been a loss of an established institution (FSS) with a profound body of knowledge. Now research seems scattered among different actors (mainly academic), as commercial providers might have other priorities and limited resources to invest in fundamental research." (emphasis mine)

To the Royal Society's point, if you're a digital analyst and there's a challenge to your conclusions or opinions, on what do you base your response or your work? For example, you've retrieved photos from a computer or phone. Your tool automatically hashes the files. But, a cryptographic hash does not guarantee the authenticity of the file, only places a unique value into the process to handle questions of integrity. How do you conduct an authenticity examination without a knowledge of statistics? You can't. How do you validate your tools without a knowledge of statistics? You can't.

Over in Australia (link), there is agreement on the need for training and research - just what I've presented. "There is however one aspect of the report with which the Society is in complete agreement; the need for both continuous training and research in forensic science. We are also aware of the lack of funding for this research and therefore support the recommendation of PCAST that this is essential if our science is to continue to develop into the future."

To conclude, yes, you do need training / education in statistics if you're engaged in any forensic science discipline. Many practitioners arrive in their fields with advanced college degrees and thus will have had exposure to stats in college. But, on the digital / multimedia side, many arrive in their fields from the ranks of the visible policing services. They may not have a college degree. They may only have tool-specific training and may be completely unaware of the many issues surrounding their discipline. It's for this group that I've designed, created, and now validated my stats class. It's made in the US, to be sure, but it's informed by the global resources listed in this post - and many others.

I hope to see you in class.

Friday, February 15, 2019

A decade later, still going strong

About a decade ago, Photoshop officially became a verb in Los Angeles and I began my quest for the tool or tools that would replace my old friend. I stumbled upon a small Italian company with an amazing product - Amped SRL and it's flagship product, FIVE. I was instantly a fan. Becoming a customer was a bit more problematic as I wasn't officially a "forensic analyst" yet. As a surveillance / counter-surveillance operator, I used the fact that FIVE could connect to a Milestone Client (my Axis pole cameras) and do all those wonderful "Photoshoppy" things to the live feed. Thus, I pitched my original purchase request noting that FIVE was an ISR tool needed to add capabilities to our night-time surveillance operations.

I finally received a license, getting quite creative in the acquisition process, and began to sort out training. There was no way that my agency would send me to Italy and it was too cost prohibitive to bring an Italian instructor to Los Angeles. Luckily, the North American reseller of Amped's products was about a half-day's drive from LA. I booked a "training session" and headed down the highway.

Upon arrival, I was greeted by a friendly face and an outstretched arm that was holding a rather tasty local brew. We discussed the filters, in no particular order. We discussed use cases, in no particular order. That I had existing expertise in photography and imaging helped me to make sense and contextualize the information. But, it wasn't "training" as I recognized it or as CA POST defined it.

I made my host an offer. I'm a trained and educated curriculum / instructional designer. I'm a CA POST certified instructor. I'll design / create / deliver a curriculum for multi-media analysis, based on Amped FIVE, and deliver it to your customers under contract. Given that I often earned about half-again my income as "comp time " (aka furloughed-in-place), and that I had to use that "comp time" rather frequently, I worked out that I could deliver a training session somewhere in North America about once per month. Agreement was reached and the relationship with Amped Software, Inc. began.

Fast forward to today. I've been all over the US as a contract instructor. I've been to Canada. I've trained agents of more than 50 countries who wanted to come to the US for their training. I've spent an amazing 3 weeks in South Africa working with their police service in modernizing their offerings. A little more than 3 years ago, I retired from the LAPD and joined the staff of Amped Software, Inc, as the Director of Support / Training.

The curriculum that was developed for the North American market is fit for purpose in this market. It's not necessarily applicable for other markets around the world, although there are many similarities. I have found that the modifications made, and the specific curriculum variant created for the US military courts easily accommodates countries with a Magistrate system of jurisprudence. When teaching courses with non-US students, I make every effort to contextualize the offerings to their context.

Whilst the rest of the world moves at a slower pace, the North American market changes quite a bit year-over-year. You might of heard that Amped decided to not continue with Axon as a reseller of it's products in this market last year. What you might not know is how the changes in the latest tax laws (federal and state) have caused significant impact to the market.

To respond to the changes in tax / business law, as well as in response to the economic / market demands, I've made the decision to expand training offerings to the on-line space via a micro-learning model as a separate business entity. Being the rights-holder of my curriculum's IP, I'm able to be flexible in where / how the curriculum is presented.

The Apex Learning portal was launched shortly after the first of this year on the LearnUpon LMS. You can find out more by clicking here. All of the training that I've presented live will eventually be offered on-line via a micro-learning model. The first course is already released - Statistics for Forensic Analysts.

If you're a long-time LEVA member, like me, you might recall my mentioning a "curriculum in a box concept." The "curriculum in box" is an "undergraduate education" in digital multimedia analysis. This will eventually be fully implemented in the Apex Learning portal. The first of these classes, the aforementioned Stats class, is already live. More courses will be released soon. Next up, however, will be a redaction class that is a response to the new laws in California - but applicable to any agency faced with redacting DME under tight budgetary and time constraints.

As budgets tighten, and travel becomes a problem, migrating training and education to the virtual space, facilitated by the micro-learning model, is the logical next step. The cost savings of not having to travel to you, or for you to travel to me, is passed along in significantly lower registration costs. As an example, an undergraduate Stats class offered at Texas A&M University would cost a Texas resident about $1200 (source). This is the base rate for the class. There are also admission fees, the fees to take the pre-requisite courses, and the travel to / from College Station over the semester. Apex is offering the course at $595.

The generic university course in statistics is geared to the academic, interested in the world of objective statistics. This world is entirely different than the statistics that underpin the forensic sciences - subjective statistics. That is why, after a solid introduction, Statistics for Forensic Analysts explores the two types of statistics separately and fairly. This class is for consumers and producers of statistics within the forensic sciences - not for the quants who inhabit the university halls.

Future offerings will be priced in a similar fashion. We're able to pass the savings on to you, and we do.

It's also worth noting that the courses on offer are not "in competition" with the other classes available to analysts. As an example, the Stats class is entirely complimentary to the LEVA Levels courses and serves to further inform these information-dense offerings. The Forensic Photographic Comparison course that will arrive on the portal later this year will similarly serve as an incredible scientific foundation to LEVA's Level 3. There's no way a single vendor can offer everything that you need. We're offering courses not currently present in the market in order to support the community - not to replace offerings from your current vendors.

Finally, I'll be updating the Forensic Photoshop book and the Forensic Photoshop course and offering them via the portal. A complete refresh of the tools and plug-ins will be featured for those who are still using Photoshop. Remember, courses like LEVA Level 3 still feature Photoshop as their platform. If a student is new to Photoshop, they must learn the meat of the course and the platform at the same time. Revamping the Forensic Photoshop course will allow the LEVA student to arrive at that course with competency in the tool, assuring that they can be all-in on the instruction. For those privateers who can't afford expensive tools from government-oriented vendors, tools from companies like Adobe are still popular. DME-specific courses are needed and will be presented in the portal.

It's an exciting time here. I'm thankful that you've been with me for this amazing journey. The next few years will bring so much change to the market. Will you join with me in embracing change and upgrading your knowledge?

Monday, January 28, 2019

Training Notice: Statistics for Forensic Analysts

I'm pleased to announce that Apex Learning, our state-of-the-art learning portal, is officially launching today with our first offering - Statistics for Forensic Analysts.

Statistics play an important and expanding role in criminal investigations, prosecutions and trials, not least in relation to forensic scientific evidence produced by expert witnesses. The Royal Statistical Society (UK) began a process in 2010 to inform and educate stakeholders in the justice system in with their publication of Fundamentals of Probability and Statistical Evidence in Criminal Proceedings. From that original work product, a total of four publications have been produced from the Society’s Statistics and the Law Section. Simultaneously, the National Commission on Forensic Science (US) began to study the issue. Several of its subcommittees have informed the discussion on the use of statistics in forensic science, issuing various guidance documents to the US Department of Justice. In 2015, the US state of Texas passed SB-1287 creating a licensing program for forensic science practitioners and analysts. Within the Texas licensing program, analysts will be tested across a variety of foundational domains in order to obtain licensure, including statistics.

What's different about Apex Learning?

To accommodate learners around the world, we're packaging these courses as micro-learning and delivering them on-line. Upon sign-up, learners have up to 60 days to complete each course.

We're leveraging a state-of-the-art learning management system to deliver quality training and education offerings that can be accessed from anywhere in the world. This reduces the cost to train / educate each analyst dramatically. We're passing the savings on to the customer, as you'll see in our first offering's price.

With PayPal, we can accept payment in the majority of the world's currencies. For institutional orders (multiple students from the same agency), we can accept bank transfers in over 30 currencies from our European based TransferWise accounts.

Our courses aren't designed to compete with anyone's offerings. They're designed to complement them by adding depth and breadth, shoring up topics that the average analyst might not be exposed to.

Stay tuned as we roll out more offerings. It's going to be a great year.

Thursday, March 6, 2008

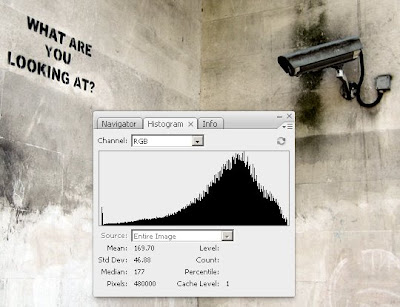
A closer look at the Histogram palette

Barbara Obermeier's Photoshop All-in-One Desk Reference For Dummies has recently been listed on Safari's on-line book service. I know by the title that some may be tempted to buy it. From an artist's standpoint, it's a nice overview of most of Photoshop's features. From a photographer's standpoint, the book seems a bit slanted towards the artist's workflow. For the most part, the book should be seen as a simple overview - and not so much an all-in-one desk reference (like the Photoshop Bibles tend to be). 

By way of illustration, turn your attention to page 573 - Introducing the Histogram Palette. "If you are into numbers, check the statistics to evaluate the image as well." Since we're into numbers, lets see where this goes ... 

Unfortunately, she doesn't get very deep into the topic. In the break-out box titled "Understanding the histogram statistics," she seems to only reprint the information available in the Photoshop help files. There is no explanation as to how the Histogram works, why it's important, or even that there is an error in the help file's explanation of a certain point (pointed out by a reader to the live help site).


So, let's take a look at the Histogram. In its simplest form, the histogram is a graph. The horizontal axis charts the brightness value. The darkest, black is on the left and white (the brightest) is on right. The vertical axis graphically displays the number of pixels in the image having the brightness value that corresponds to that position on the horizontal axis. OK. So what about the statistics? Here's how the book and the help files explain them (with my comments added):
  • Mean: Average intensity value (the average brightness value of all pixels)
  • Standard Deviation: How much the intensity values vary (how much variation there is in the tonality of the image) (small deviation = steep curve - large deviation = broad curve) (more below)
  • Median: Middle value of the intensity value range (the point where half the pixels are darker and half are lighter)
  • Pixels: Total number of pixels used to represent (calculate) the histogram
  • Cache Level: The current level of image cache used to calculate the histogram (this one is tricky - The original image is Cache Level 1. For each level above 1, four adjacent pixels are averaged to arrive at a single pixel value [notice the warning triangle]. Thus, each cache level has 25% of pixels of the level below it. When Photoshop needs a quick approximation, it uses one of the top levels. Click on the Uncached Refresh button [looks like the recycle arrows] above the warning triangle to redraw the image's histogram using the actual pixels.)


Once we've performed a levels or curves adjustment, the tonality is restored and the graph's peak appears to be more centred. In the first histogram, the Standard Deviation was just above 30. A standard Deviation below 30 often indicates a lack of tonality, just as over 90 indicates extremes in contrast. With our adjustments made, the Standard Deviation is squarely in the middle of the acceptable range of 40-60, indicating a good tonal range.


In the final image, I've placed the cursor in such a spot to find the place from which half the pixels will be lighter and half will be darker (Percentile: 49.51 was as close as I could get). Ordinarily, this place would be Level 128 (0-255), but in our image it's Level 156. This explains the peak's shift to the right of the graph. The Count is a bit misleading. As a comment on the help files page at Adobe illustrates, "the sum of all counts shown in the histogram is not equal to "Pixels" - it is actually equal to 3X the "Pixels". Adobe's page and the Desk Reference fail to note that the count is taken per channel, thus the 3x factor as pointed out by the comment.

And finally a word of warning, Photoshop's Histogram Statistics are designed for 256 levels. With a 16bpc workflow, there may be variations that do not show in the statistics. This problem can be solved rather easily with the free Wide Histogram plug-in from Reindeer Graphics.

To wrap up, having a subscription to O'Reilly's Safari Books is a great way to sample new titles. The monthly subscription price is roughly equal to the price of a single new book per month. I do like to have the printed versions of my favourites, so I use O'Reilly as a screening service; buying the titles I like and saving money by not buying the titles that look good on first glance but lack the depth that I'm looking for. As an example, I just purchased Switching to the Mac: The Missing Manual, Leopard Edition, by David Pogue from Safari to help in the transition from PC to Mac - saving 35% off the cover price in the process.

As far as the Desk Reference goes, it's 4/5 for beginning artists and a 3/5 for everyone else. I do love the cartoons from Rich Tennant. However, in helping us build our storytelling database, really getting in depth, I'm sorry to say that it doesn't even crack the scale.

Monday, March 25, 2019

Statistical Significance and Reporting Language

There's been a lot of talk lately about removing "statistical significance" from the reporting language of scientists, and forensic scientists. Many believe that the use of the term deliberately confuses the Trier of Fact and relies upon the fact that most are ignorant of statistics and their foundations.

The limitations of significance is one of the topics covered in Statistics for Forensic Analysts, my stats class that has migrated from the classroom to our on-line micro-learning portal.


Statistics form the foundation of much of what we do in

  • Forensic Video Analysis
  • Forensic Audio Analysis
  • Digital Forensics
  • Latent Print Examinations
  • Questioned Document Examinations
  • Toolmark / Firearms / Treadwear Examinations
  • Shooting Incident Reconstructions
  • Traffic Investigations / Recreations
With so many folks needing to gain knowledge / experience in statistics, offering the course on-line and allowing sign-up at any time allows us to get this valuable information out to as many people as possible in the shortest amount of time. No need to wait for the next class, no conflicting schedules. Just sign-up and begin learning.

Click here for more information, or to sign-up today.

Wednesday, February 6, 2019

Training, training, and more training

With the new year comes new tax laws, new regulations, and new rules that require businesses and individuals to modify their path as they navigate the world of governmental compliance. It's no different here in stormy southern Nevada.

But, with change comes opportunity. 2019 brings change for the better, and more training offerings than ever before.

I've already announced the release of Statistics for Forensic Analysts. This is offered as micro-learning, on-line and on-demand and comes in response to initiatives at the federal and state level. Given that statistics form the foundation of much of opinion based testimony in the digital forensic sciences, as well as the other disciplines that offer photographic comparison evidence (latent print, tool mark, firearms, questioned documents, etc), this class is designed to provide the necessary instruction in statistics - specifically tailored for forensic science practitioners.

With redaction begin the focus of much of the US, as well as being the focus of a new set of laws in California, I've announced a redaction class specific for California agencies to help not only with mastering the technology ... but also navigating complex a legal context. This class comes in four versions, if you will. If you're an Amped Software customer, the hands-on learning will be facilitated with Amped FIVE (video) and Audacity (audio). If you're an Adobe customer, the hands-on learning will be facilitated with the Adobe Creative Suite. If you're a Magix customer, the hands-on learning will be facilitated with Vegas and Sound Forge. And, if you haven't decided on a solution, our general class will provide an overview of all of these solutions, giving you a sense of what may work best for you, your agency, and your legal context. Even if you're not in California, their strict regime's rules help to illustrate the many compliance issues you may not realize apply to you and your agency.

All of these redaction classes will be offered via micro-learning, maximizing your training dollars and offering significant savings over traveling to training. Partnering with LearnUpon for the LMS, these micro-learning sessions are available world-wide with local currency payment options via Square, PayPal, or TransferWise. They will also be offered in Henderson, NV. If you've got a big group, and you'd like a training session at your location, that can be arranged as well. In fact, all of the offerings going forward will be available this way - on-line, in Henderson, or at your location.

It's going to be an exciting year. I'm excited that technology has evolved such that it's becoming easier and more cost effective to offer flexible training options. So stay tuned, it's going to be a fun ride. New offerings will be rolling out each month. In the meantime, head over and sign up for Statistics for Forensic Analysts ...

Tuesday, February 25, 2020

Sample Size? Who needs an appropriate sample?

Last year, I spent a lot of time talking about statistics and the need for analysts to understand this important science. Ive written a lot about the need for appropriate samples, especially around the idea of supporting a determination of "match" or "identification."

Many in the discipline have responded essentially saying, it is what it is - we don't really need to know about these topics or incorporate these concepts in our practice.

Now comes a new study from Sophie J. Nightingale and Hany Farid, Assessing the reliability of a clothing-based forensic identification. If you've been to one of my Content Analysis classes, or one of my Advanced Processing Techniques sessions, reading the new study won't yield much new information from a conceptual standpoint. It will, however, lend a bunch of new data affirming the need for appropriate samples and methods when conducting work in the forensic sciences.

From the new study: "Our justice system relies critically on the use of forensic science. More than a decade ago, a highly critical report raised significant concerns as to the reliability of many forensic techniques. These concerns persist today. Of particular concern to us is the use of photographic pattern analysis that attempts to identify an individual from purportedly distinct features. Such techniques have been used extensively in the courts over the past half century without, in our opinion, proper validation. We propose, therefore, that a large class of these forensic techniques should be subjected to rigorous analysis to determine their efficacy and appropriateness in the identification of individuals."

The important thing about the study is that the authors collected an appropriate set of samples to conduct their analysis.

Check it out and see what I mean. Notice how the results develop from the samples collected. See how they differ from an examination of a single image. Thus, I always say, under a certain sample size, you're better off flipping a coin.

If, after reading the paper, you're interested in increasing your knowledge of statistics and experimental science, feel free to sign-up for Statistics for Forensic Analysts.

Have a great day, my friends.

Saturday, February 29, 2020

A D.C. judge issues a much-needed opinion on ‘junk science'

Radley Balko is at it again. This time, the focus of his attention is a ruling is tool-mark analysis.

"This brings me to the September D.C. opinion of United States v. Marquette Tibbs, written by Associate Judge Todd E. Edelman. In this case, the prosecution wanted to put on a witness who would testify that the markings on a shell casing matched those of a gun discarded by a man who had been charged with murder. The witness planned to testify that after examining the marks on a casing under a microscope and comparing it with marks on casings fired by the gun in a lab, the shell casing was a match to the gun.

This sort of testimony has been allowed in thousands of cases in courtrooms all over the country. But this type of analysis is not science. It’s highly subjective. There is no way to calculate a margin for error. It involves little more than looking at the markings on one casing, comparing them with the markings on another and determining whether they’re a “match.” Like other fields of “pattern matching” analysis, such as bite-mark, tire-tread or carpet-fiber analysis, there are no statistics that analysts can produce to back up their testimony. We simply don’t know how many other guns could have created similar markings. Instead, the jury is simply asked to rely on the witness’s expertise about a match."

As noted in the previous post, the "pattern matching" comparisons are prone to error when an appropriate sample size is not used as a control.

The issue, as far as statistics are concerned, is not necessarily the observations of the analyst but the conclusions. Without an appropriate sample, how does one know where the observed results would fall within a normal distribution? Are the results one is observing "typical" or "unique?" How you would know? You would construct a valid test.

Balko's point? No one seems to be doing this - conducting valid tests. Well, almost no one. I certainly do - conduct valid tests, that is.

If you're interested in what I'm talking about and want to learn more about calculating sample sizes and comparing observed results, sign up today for Statistics for Forensic Analysts (link).

Have a great weekend, my friends.

Wednesday, April 3, 2019

Why do you need science?

An interesting morning's mail. Two articles released overnight deal with forensic video analysis. Two different angles on the subject.

First off, there's the "advertorial" for the LEVA / IAI certification programs in the Police Chief Magazine.

The pitch for certification was complicated by this image:


The caption for the image further complicated the message for me: "Proper training is required to accurately recover or enhance low-resolution video and images, as well as other visual complexities."

Whilst the statement is true, do you really believe that the improvements to the image happened from the left to the right? Perhaps, for editorial purposes, the image was degraded, from the original (R) to the result (L). If I'm wrong about this, I'd love to see the case notes and the specifics as to the original file. Can you imagine such a result coming from the average CCTV file? Hardly.

Next in the bin was an opinion piece in the Washington Post's Radley Balko - "Journalists need to stop enabling junk forensics." It's seemingly the rebuttal to the LEVA / IAI piece.

Balko picks up where the ProPublica series left off - an examination of the discipline in general, and Dr. Vorder Brugge of the FBI in particular. It's an opinion piece, and it's rather pointed in it's opinion of the state of the discipline. Balko, like ProPublica, has been on this for a while now (here's another Balko piece on the state of forensic science in the US).

I don't disagree with any of the referenced authors here. Not one bit. Jan and Kim are correct in that the Trier of Fact needs competent analysts working cases. Balko is correct in that the US still rather sucks at science. That we suck as science was the main reason the Obama administration created the OSAC and the reason Texas created it's licensing scheme for analysts.

Where I think I disagree with Jan and Kim is essentially a legacy of the Daubert decision. Daubert seemingly outsourced the qualification process to third parties. It gave rise to the certification mills and to industry training programs. Training to competency means different things to different organizations. For example, I've been trained to competency on the use of Amped's FIVE and Authenticate. But, none of that training included the underlying science behind how the tool is used in case work. For that, I had to go elsewhere. But, Amped Software, Inc, certified me as a user and a trainer of the tools. That (certification) was just a step in the journey to competency, not the destination.

Balko, like ProPublica, notes the problems with pattern evidence exams. Their points are valid. But, it doesn't mean that image comparison can't be accomplished. It does mean that image comparisons should be founded in science. One of those sciences is certainly image science (knowing the constituent parts of the image / video and how the evidence item was created, transmitted, stored, retrieved, etc. But another one of the sciences necessary is statistics (and experimental design).

As I noted in my letter to the editor of the Journal of Forensic Identification, experimental design and statistics form a vital part of any analysis. For pattern matching, the evidence item may match the CCTV footage. But, would a representative sample of similar items (shirts, jeans, etc) also match? Can you calculate probabilities if you're unaware of the denominator in the function (what's the population of items)? Did you calculate the sample size properly for the given test? Do you have access to a sample set? If not, did you note these limitations in your report? Did these limitations inform your conclusions?

Both LEVA and the IAI have a requirement for their certified analysts to seek and complete additional training / education towards eventual recertification. This is a good thing. But, as many of us know, there are only so many training opportunities. At some point, you kind of run out of classes to take is a common refrain. Whilst this may be true for "training" (tool / discipline specific), this is so not true for education. There are a ton of classes out there to inform one's work. The problem there becomes price / availability. This price / availability problem was the primary driver behind my taking my Statistics class out of the college context and putting it on-line as micro learning. My other classes from my "curriculum in a box" concept will roll out later this year and into the next year.

So to the point of the morning's articles - yes, you do need a trained / educated analyst. Yes, that analyst needs to engage in a scientific experiment - governed both by image science as well as experimental science. Forensic science can be science, if it's conducted scientifically. Otherwise, it becomes a rhetorical exercise utilizing demonstratives to support it's unreproducible claims.

Monday, January 14, 2019

Test your report's readability

One of the concepts that I tend to repeat when training folks in the forensic sciences is that our work should target the last mechanical device that will display or project our work products as well as targeting the combined perceptual abilities of the Trier of Fact. Working in this way, there will be no surprises when it comes to presenting your work.

The same is true for your reports. Your reports will make sense to you. You wrote them. They'll make sense to your quality control staff (your reviewers) as they tend to exist in the same culture and climate as you. But, will they make sense to the Trier of Fact - without you having to explain it to them?

There is functionality within our toolset to help with this question - how readable is my report? If you're using MS Word to draft your reports, it's actually quite easy to set this up.

  • Click the File tab, and then click Options.
  • Click Proofing.
  • Under When correcting spelling and grammar in Word, make sure the Check grammar with spelling check box is selected.
  • Select Show readability statistics.


After you enable this feature, open a file that you want to check, and check the spelling by pressing F7 or going to Review > Spelling & Grammar. When Word finishes checking the spelling and grammar, it displays information about the reading level of the document.


Each readability test bases its rating on the average number of syllables per word and words per sentence. The following sections explain how each test scores your file's readability.

Flesch Reading Ease test (references)

Originally developed for the US Navy in 1975, this test rates text on a 100-point scale. The higher the score, the easier it is to understand the document. For most forensic science processing / analysis reports, you want the score to be between 55 and 70. Given that we'll have to use standard scientific terminology, it will be difficult to achieve readability scores higher than 70.

The formula for the Flesch Reading Ease score is:

206.835 – (1.015 x ASL) – (84.6 x ASW)

where:

ASL = average sentence length (the number of words divided by the number of sentences)

ASW = average number of syllables per word (the number of syllables divided by the number of words)

Flesch-Kincaid Grade Level test

This test rates text on a U.S. school grade level. For example, a score of 8.0 means that an eighth grader can understand the document. For your reports, aim for a score of approximately 7.0 to 10.0. It will prove difficult to bring these values down, as noted above, due to our use of scientific language which gets averaged into the total score.

The formula for the Flesch-Kincaid Grade Level score is:

(.39 x ASL) + (11.8 x ASW) – 15.59

where:

ASL = average sentence length (the number of words divided by the number of sentences)

ASW = average number of syllables per word (the number of syllables divided by the number of words)


The Readability Statistics shown above is from a raw authentication report - before editing and before the insertion of the plain English explanations for each of the processes.

Given that about 95% of cases plea and never see the inside of a court room, it's vitally important that your reports be readable.  95% of your reports will be read, interpreted, and acted upon without your being present to help the reader understand what you said / meant. With this simple tool that is built into many word processing applications, you can assure that your reports are readable, and at what grade level.

If you're using Google Docs, you'll need to run your report through another app or web site. Readability Statistics were removed some time ago.

Enjoy.

Monday, August 19, 2013

The Language of Statistics

You may be asked to express the results of your work on a case in the language of statistics. What was your hypothesis? How did you test your hypothesis? You are offering an opinion. On what is your opinion grounded? If you believe that the man in the picture is the defendant, how do you express this belief? Would you enter into the discussion with some variation of Null = not the defendant / Alternative = the defendant? If you go down this road, be prepared to talk in the language of statistics.

Can We Accept the Null Hypothesis?

Some researchers say that a hypothesis test can have one of two outcomes: you accept the null hypothesis or you reject the null hypothesis. Many statisticians, however, take issue with the notion of "accepting the null hypothesis." Instead, they say: you reject the null hypothesis or you fail to reject the null hypothesis.

Why the distinction between "acceptance" and "failure to reject?" Acceptance implies that the null hypothesis is true. Failure to reject implies that the data are not sufficiently persuasive for us to prefer the alternative hypothesis over the null hypothesis.

How did you conduct your hypothesis tests?

Statisticians follow a formal process to determine whether to reject a null hypothesis, based on sample data. This process, called hypothesis testing, consists of four steps.

State the hypotheses. This involves stating the null and alternative hypotheses. The hypotheses are stated in such a way that they are mutually exclusive. That is, if one is true, the other must be false.

Formulate an analysis plan. The analysis plan describes how to use sample data to evaluate the null hypothesis. The evaluation often focuses around a single test statistic.

Analyze sample data. Find the value of the test statistic (mean score, proportion, t-score, z-score, etc.) described in the analysis plan.

Interpret results. Apply the decision rule described in the analysis plan. If the value of the test statistic is unlikely, based on the null hypothesis, reject the null hypothesis.

If you're not prepared to go down this road - DON'T. Simply explain your workflow and present your findings: this is what I did and this is what I found. If you are clarifying / enhancing images and video - don't talk in the language of stats about your results. You didn't conduct an experiment, you simply made the image / video more clear and usable for the trier of fact. In doing this, you didn't analyze the file, you just cleaned it up.

Thursday, April 4, 2019

The "NAS Report," 10 years later

It's been a bit over 10 years since Strengthening Forensic Science in the United States, a Path Forward was released (link). What's changed since then?

As a practitioner and an educator, Chapter 8 was particularly significant. Here's what we should all know - here's what we're all responsible for knowing.


"Forensic Examiners must understand the principles, practices, and contexts of science, including the scientific method. Training should move away from the reliance on the apprentice-like transmittal of practices to education ..."

10 years later, has the situation changed? 10 years later, there are a ton of "apprentice-like" certification programs and just a handful of college programs. College programs are expensive and time consuming. Mid-career professionals don't have the time to sit in college classes for years. Mid-career professionals don't have the money to pay for college. Those that have retired from public service and "re-entered" their profession on the private side face the same challenges.

Years ago, I designed a curriculum set for an undergraduate education in the forensic sciences. It was designed such that it could form the foundation for graduate work in any of the forensic sciences - with electives being being discipline specific. I made the rounds of schools. I made the rounds of organizations like LEVA. I made my pitch. I got nowhere with it. Colleges are non-profit in name only, it seems.

To address the problems of time and money, as well as proximity, I've moved the box of classes on-line. The first offering is out now - Statistics for Forensic Analysts. It's micro learning. It's "consumer level," not "egg head" level. It's paced comfortably. It's priced reasonably. It's entirely relevant to the issues raised in the NAS Report, as well as the issues raised in this month's edition of Significance Magazine.

I encourage you to take a look at Statistics For Forensic Analysts. If you've read the latest issue of Significance, and you have no idea what they're talking about or why what they're talking about is vitally important, you need to take our stats class. Check out the syllabus and sign-up today.

Monday, July 2, 2012

Small towns adjusting to life without police depts.

This just in from PoliceOne.com: "It's a crime what City Hall did last month, some residents of this town say.

But eliminating the entire police department — chief and all — is just a sign of these penny-pinching times, according to law enforcement experts.

That's little comfort to Cleo Brewer and other townsfolk, many of them retired and living on fixed incomes.

"No one wants to say their town doesn't have a police force. It's an invitation for trouble," said Brewer, owner of the Western Cafe, a popular eatery that has been tempting patrons with its catfish plate specials for 25 years.

Other residents of this relatively quiet town of 1,100 say the city simply had no choice.

For several years now across the country, rural towns like Kemp have been disbanding their police departments because they can't afford them anymore. While the overall number of law enforcement agencies in the nation went up from 2004 to 2008 — the latest years for which national statistics were available — smaller departments with fewer than 10 officers dipped about 2.3 percent, according to data from the U.S. Bureau of Justice Statistics ..."

To continue reading the story, click here.

Wednesday, May 21, 2014

Integrity in all that we say and do

In the latest edition of Evidence Technology Magazine (print version), there's an editorial that discusses the problems with experts in forensic science who often have no training in science or awareness of the basics of the scientific method. The author illustrates the point using the privateer working in their garage as an exemplar for shoddy practice. While the case might be made for these folks causing problems in the courts, they're easy to spot. Just ask some very specific questions - training, experience, recent case testimony, etc. Sure, they might know about computers. They might have a CIS degree. But, what training and experience do they have with DVRs? What's their procedure? Has it been validated? What tools do they use? Are they generally accepted amongst the industry's experts? Have those tools been validated? Etc.

Yet, as much as the problem of bogus experts might be, there's likely a worse problem lurking under the surface - the systemic fraud of "just trying to get something done" that is regularly employed in government agencies. If it's a fraud for untrained and poorly equipped privateers to try to pass off their work as relevant and reliable, is it not also a fraud when a law enforcement agency's employee does the same thing? Is it not systemic when the agency not only permits it to occur, but encourages it through a climate and culture of "just trying to get things done."

The root of this problem might just be the NYPD's CompStat program, a "data driven program" that has spread around the country. As employees rush to clear cases and pressure is exerted to "just get things done," can the public trust the stats that are generated in this environment?

"... what if the data were somehow skewed?

That question has emerged as one of the by-products of a survey conducted by two criminologists that has raised doubts about the integrity of the New York Police Department’s highly regarded crime tracking program, CompStat. Relying on the anonymous responses of hundreds of retired high-ranking police officials, the survey found that tremendous pressure to reduce crime, year after year, prompted some supervisors and precinct commanders to distort crime statistics."

So as I work away at eventually receiving a PhD, and sit through seemingly endless lectures on reliability and validity in dealing with statistics, there is (quite sadly) a gaping hole in the CompStat media campaign - validity and reliability studies from independent researchers. From what I've read on the issue, there's a huge co-mingling of causation / correlation narratives, but not a lot of reliable data supporting CompStat as valid and reliable.

Thus, if there's a pressure to perform, might there be a pressure to "just get something done" in the lab? Do you honestly think that if a whole agency is skewing the CompStat books - that pressure to cook the books does not exist in the lab? If they are skewing the data (and thus the results), is this any worse, or better, than the privateer in the Evidence Technology Magazine article? If government employees are ignoring the scientific method, using unproven/unvalidated tools and techniques, working outside of their scope of expertise, I would argue that it's worse, far worse.

Friday, May 31, 2019

Is it practical?

Continuing the discussion of certification in general, the NAS Report notes the following about certification programs, "The American Bar Association has recommended that certification standards be required of examiners, including “demanding written examinations, proficiency testing, continuing education, recertification procedures, an ethical code, and effective disciplinary procedures.” Let's break these down.

Demanding written exams. What does this mean? Are "written exams" composed of essay questions where one explains topics in depth? Are "written exams" objective tests, like multiple choice exams? What makes an exam "demanding?"

Could an examination body survey the entirety of my written work, books, papers, speeches, this blog, and so on? Could they judge my proficiency based on my written work? I'm not sure. But, pulling from my academic life, it is entirely possible for someone to be proficient in their craft, but be non-verbal. How do you conduct a "demanding written exam" on a non-verbal person? What about differences of language? Do we insist upon all tests being in US English? How do we handle the issue of testing vulnerable populations? Given my extensive work in the autistic community, both academically and professionally, these are relevant questions.

Proficiency testing. Does this belong to an independent certification program or within a vendor's training program? For example, who is a better judge of my proficiency with my chosen tools, Amped Software, Inc. (vendor) or the IAI (third party)? What does the IAI know about FIVE and Authenticate? Nothing, actually. They're still focussed on Photoshop. How do I know this? Their reading list has George Reis' Photoshop book as one of the sources for the test. Whilst still relevant, and quite good, it's a 10 year old treatise on George's favorite PS techniques in no particular order. Given that I no longer use Photoshop in my analytical workflow, how is a test on Photoshop helpful in assessing my proficiency as an examiner?

Perhaps the "requirement" could be met with a review of an analyst's case documentation. Submit a few reports, have the panel examine them in light of the ASTM and SWGDE standards / guidelines.

Continuing education. There comes a point in time, when you've been doing this for a while, that you run out of classes to take. Some, that are available, are cost prohibitive. That's a large part of why I've moved a lot of the classes that I teach to an LMS as micro-learning. As an example, if you can't get in to your local college to take a statistics course, you can take Statistics for Forensic Analysts on-line at an affordable price. Same for redaction, Redaction for Standards Compliance is offered on-line featuring a variety of software platforms.

I've been around the US and Canada quite a bit. I realize that traveling to training is not always an option. I think the internet offers some amazing options to level the playing field as regards continuing education. The question becomes, will your chosen certification program accept your completion certificate from an on-line course or provider?

Recertification procedures. I think the important part here is not only that the individual circle back and re-certify, but that the certification program continually monitors the industry and keeps the certification program up to date. Four years from now, when my AVFA certification is due for renewal, I should not be presented with the same test instrument. Laws and technology change. So too should the certification program. Again, I love George Reis to death, but is his book still relevant in a modern multimedia workflow? Perhaps. But are there other, more appropriate texts? Yes. Absolutely. What about listing Dr. John Russ' Image Processing Cookbook as well, given the preference for Photoshop? Or his Image Processing Handbook, for a more academic look at image processing? If price is an issue, they could choose Fundamentals of Digital Image Processing by Dr. Anil Jain. It's a text book that can be bought used for under $10.

Ethical code. Here's LEVA's Code of Ethics. This post is an example of article 5 in LEVA's COE, offering constructive criticism. Interestingly, article 9 is what prevented me from ever being LEVA certified. Article 9 states, "An Analyst shall maintain the confidentiality of evidence received and work undertaken in accordance with any such request by the submitting agency." It was the policy of the Los Angeles Police Dept. that case work remain confidential and no evidence leave the secure facility without permission. When I sought permission to begin the process of certification, it was flatly denied. Given the LEVA certification methodology, if you can't present one of your cases, you can't get certified. Thus, in honoring their COE, I was prevented from ever being certified whilst in police service. Now, in retirement and in private practice, LEVA discriminates against me for not being a current public service employee by charging confiscatory prices for their offerings.

For the IAI's COE, click here. It begins on pg 79 of the linked document.

Effective disciplinary procedures. One of the things that we do is review opposing counsel's analysis. The examiner on the other side of any case should expect a thorough review of not only their work but their credentials as submitted through the discovery process. I have lost track of the amount of times I have encountered embellishments and fabrication of credentials by analysts, some of which have been certified by LEVA or the IAI. Everything you write in your report should be factual. Everything you write about yourself should be verifiable. As an example of this, I note as a matter of fact that I am retired from police service, having served just shy of 15 years with the Los Angeles Police Dept. under civil service classification 3687. This is a verifiable statement. I can provide the job description for civil service classification 3687, or you can click on the link in the previous sentence. I can provide my retiree ID. I could even print out an account statement from the City's retirement plan noting how many years/months I have of retirement credits (an indication of years/months worked). But, if I simply quit my job, it is a slightly different process than retiring. Thus, I wouldn't say that I had retired, but that I had quit / separated / moved on - or some other term that would accurately describe the end of my time in police service. Same goes for my education. No embellishment, just a simple presentation of the facts.

Back to ethics, there have been a few times that I reported my findings to a certification body. To the best of my knowledge, nothing was ever done with the information that I provided. This is the problem with most professional organizations. We're all friends. No one wants to judge their friends. No waves. No trouble. Let it slide. If there are no consequences, there's no effective discipline.

As these all relate to the certification experience that I just undertook, the AVFA includes all elements except the "proficiency test." I was not given an item of evidence and asked to examine it vs. a question under enquiry. Could my body of work stand in a proficiency test's stead? How much have I written? How many courses of instruction have I designed? How many have I trained to competency? How many cases have I worked? After all, it's this body of work that prepared me to take and pass the exam.

Getting back to the NAS Report, "In essence, ‘certification’ usually means that a particular individual has completed a defined course of education, training, and experience, and has passed an examination prepared by peers which demonstrates that the individual has obtained at least the minimum level of competence required to practice the specific discipline." My education, training, and experience prepared me to take and pass the examination that was prepared by peers, thus demonstrating to the certificate program a minimum level of competence. As to the peers who prepared the exam, I may not know a single one of them, but having a list of names with contact information is a great start.

Monday, May 27, 2019

When the data supports no conclusion, just say so

I can't quantify the amount of requests I've received over the years where investigators have asked me to resolve a few pixels or blocks into a license plate or other identifying item. If, at the Content Triage step, nominal resolution isn't sufficient to answer the question, I say so.

When the data supports no conclusion, I try to quantify why. I usually note the nominal resolution and / or the particular defect that may be getting in the way - blur, obstruction, etc. What I don't do is equivocate. Quite the opposite, I try to be very specific as to why the question can't be answered. In this way, there is no ambiguity in my conclusion(s).

Additionally, whomever is responsible for the source of the evidence will have insight as to potential improvements to the situation. For example, if the question is "what is license plate," and the camera is positioned to monitor a parking lot, then the person / company responsible for the security infrastructure can be alerted to the potential need for additional coverage in the area of interest. This could mean additional cameras, or a change in lensing, or ...

Why this topic today?

I received a link to this article in my inbox. "Expert says Merritt truck ‘cannot be excluded’ as vehicle on McStay neighborhood video." Really? "Cannot be excluded?" What does, "cannot be excluded" mean?

At issue is a 2000 Chevy work truck, similar to the one below. Chevy makes some of the most popular trucks in the US, second only to Ford. This case takes place in Southern California, home to more than 20m people from Kern to San Diego counties.


"Cannot be excluded" is not a conclusion, it's an equivocation. Search CarFax.com for used Chevy Silverado 3500 HD trucks for sale within a 100 mile radius of Fallbrook, CA (92028). I did. I found  49 trucks for sale on that site. 49 trucks that "cannot be excluded" ... AutoTrader listed 277 trucks for sale. 277 more trucks that "cannot be excluded" ...

All of this requires us to ask a question, is the goal of a comparative analysis to "exclude" or to "include?" How would you know if you've never taken a course in comparative analysis? Perhaps we can start with the SWGDE Best Practices for Photographic Comparison for All Disciplines. Version: 1.1 (July 18, 2017) (link):

Class Characteristic – A feature of an object that is common to a group of objects.
Individualizing Characteristic – A feature of an object that contributes to differentiating that object from others of its class.

5.2 Examine the photographs to determine if they are sufficient quality to complete an examination, and if the quality will have an effect on the degree to which an examination can be completed. Specific disciplines should define quality criteria, when possible, and how a failure to meet the specified quality criterion will impact results. (This may apply to a portion of the image, or the image as a whole.)
5.2.1 If the specified quality criteria are not met, determine if it is possible to obtain additional images. If the specified quality criteria are not met, and additional images cannot be obtained, this may preclude the examiner from conducting an examination, or the results of the examination may be limited.
5.3 Enhance images as necessary. Refer to ASTM Guide E2825 for Forensic Digital Image Processing.

These steps are the essence of the Content Triage step in the workflow - do I have enough nominal resolution to continue processing and reach a conclusion?

But, there is more to this process than just a comparison of a "known" and an "unknown." How does one go from "unknown" to a "known" for a comparison? How do you "know" what is "known?" First, you must attempt a Vehicle Make / Model Determination of the vehicle in the CCTV footage.

For a Vehicle Make / Model Determination, the SWGDE Vehicle Make/Model Comparison Form. Version: 1.0 (July 11, 2018) (source) is quite helpful.

How many features are shared between model years in a specific manufacturer's product line? Class Characteristics can help get you to "truck," then to "work truck" (presence of exterior cargo containers not typically present in a basic pickup truck), then to "make" based on shapes and positions of features of the items found in the Comparison form. The form can be used to document your findings.

You may get to Make, but getting to Model in low resolution images and video can be frustrating. What's the difference between a Chevy Silverado 1500, 1500LD, 2500HD, 3500HD? There are more than 10 trim variations of the 1500 series alone. What's the difference between a 2500HD and a 3500HD?

After you've documented your process of going from "object" to "work truck" to a specific model of work truck, how do you move beyond class, to make, to model, to year, to a specific truck? Remember, an Individualizing Characteristic is a feature of an object that contributes to differentiating that object from others of its class. Before you say "headlight spread pattern," please know that there is no valid research supporting "headlight spread pattern" as an individualizing characteristic - NONE. I know that there are cases where this technique has been used, but rhetoric is not science. Many jurisdictions, such as California and Georgia, will allow just about everything in at trial, so not having one's testimony excluded at trial is not proof of anything scientific.

Taking your CCTV footage, you've made your make / model / year determination using the SWGDE's form. Now, how do you move to an individual truck?

This is where basic statistics and inferential reasoning are quite necessary. Do you have sufficient nominal resolution to pick out identifying characteristics in the footage? If not, you're done. The data supports no conclusion as to individualization.

But assuming that you do, how do you work scientifically and as bias free as possible? Unpack the biasing information that you received from your "client" and design an experiment. In the US, given our Constitutional provisions that the accused are innocent until proven guilty, it is for the prosecution to prove guilt. Thus, the staring point for your experiment is that the truck in question is not a match. With sufficient nominal resolution, you set about to prove that there is a match. If you can't, there is no match as far as you're concerned. Remember, the comparative analysis should not be influenced by any other factors or items of evidence.

In designing the experiment, you'll need a sample set of images. You see, a simple "match / no match" comparison needs an adequate sample. It perverts the course of justice to simply attempt the comparison on the accused's vehicle. We don't do witness ID line-ups with just the suspect. Neither should anyone attempt a comparison with just a single "unknown" image - the accused's. Yes, I do use this specific provision of English Common Law to explain the problem here. Perverting the Course of Justice can be any of three acts, fabricating or disposing of evidence, intimidating or threatening a witness or juror, intimidating or threatening a judge. In this case, one Perverts the Course of Justice when one fabricates a conclusion (scientific evidence) where none is possible.

Back to the experiment. How many "unknown" images would you need to approach 99% confidence in your results, thus assisting the course of justice? Answer = 52. How did I come up with 52?

Exact - • Generic binomial test
Analysis: A priori: Compute required sample size
Input: Tail(s)                   = One
Proportion p2 = 0.8
α err prob = 0.01
Power (1-β err prob)     = .99
Proportion p1             = 0.5
Output: Lower critical N = 35.0000000
Upper critical N         = 35.0000000
Total sample size         = 52
Actual power             = 0.9901396
Actual α = 0.008766618

A generic binomial test is similar to the flip of a coin - only two possible outcomes, heads / tails or match / no match. It's the simplest test to perform.


The error probability is your chance of being wrong. At 52 test images, you've got a 1 in 100 chance of being wrong (.99). As you move below 15 test images, you have a greater chance of being wrong than being right. With a sample size of 1, you're likely more accurate tossing a coin.

The 52 samples help us to get to make / model / year. You may chose to refresh those samples with new ones to perform a "blind comparison," and attempt to "include" the suspect's vehicle in your findings. To do this, you'd need the specific description of the "known" vehicle that makes it unique vs the others in the sample.

If I were performing a make / model / year determination, and then a comparison, I would note any errors or limitations in my report. If the data supported no conclusion, or if the limitations in the data prevented me from arriving at a determination, I would note that the data supported no conclusion. If I was able to make a determination, I would have noted my process and how I arrived at the conclusion (in a reliable, valid, and reproducible fashion).

The problem with the reporting of the case is the "cannot be excluded" portion is in the headline. One has to read deeper into the article to find, "... Liscio denied  (that his conclusions may have been formed to fit the bias of the prosecution, who was paying him...), and reminded McGee more than once that he had not identified the truck specifically as Merritt’s..."

Which requires another question be asked, if the analyst had not identified the vehicle, what was he doing there in testimony?

"Among the items that helped to reach the conclusion that the vehicle was “consistent” with Merritt’s truck was a glint caught by the video that matched the position of a latch on a passenger-side storage box toward the rear of the truck, said Liscio,who uses 3D imagery."

Here we move from "cannot be excluded" to "consistent with," another equivocation. How does one not identify a vehicle, but find that said unknown vehicle is "consistent with" the "known" vehicle? This is the problem with Demonstrative Comparisons. When you place a single "known" against a single "unknown" in a demonstrative exhibit, you are making a choice as to what to include in your exhibit - thus you have concluded.

Back to the demonstrative. What is it about the latch on the side of the truck that is unique? Won't all work trucks of this type have latches on their cargo containers? Why is this one so special that it can only be found on the accused's truck? Of these questions, the article does not give an answer.

"I’m not saying that this your client’s vehicle,” Liscio repeated. “All I am saying is that the vehicle in question is consistent with my report, and if there is another vehicle that looks similar, that is possible.” How about at least 326 vehicles found on just two used car web sites?

If you'd like to explore these topics in depth, I'd invite you to sign up for any one (or all) of our upcoming training sessions. Our Statistics for Forensic Analysts course is offered on-line as micro learning and thus enrollment can happen at your convenience. Our other courses can be facilitated at your location or at ours, in Henderson, NV.

Saturday, August 1, 2009

CCTV Statistics

"The borough of Wandsworth has the highest number of CCTV cameras in London, with just under four cameras per 1,000 people. Its total number of cameras - 1,113 - is more than the police departments of Boston [USA], Johannesburg and Dublin City Council combined."

Check out this interesting article on the proliferation of CCTV in the UK by clicking here.