Radley Balko is at it again. This time, the focus of his attention is a ruling is tool-mark analysis.
"This brings me to the September D.C. opinion of United States v. Marquette Tibbs, written by Associate Judge Todd E. Edelman. In this case, the prosecution wanted to put on a witness who would testify that the markings on a shell casing matched those of a gun discarded by a man who had been charged with murder. The witness planned to testify that after examining the marks on a casing under a microscope and comparing it with marks on casings fired by the gun in a lab, the shell casing was a match to the gun.
This sort of testimony has been allowed in thousands of cases in courtrooms all over the country. But this type of analysis is not science. It’s highly subjective. There is no way to calculate a margin for error. It involves little more than looking at the markings on one casing, comparing them with the markings on another and determining whether they’re a “match.” Like other fields of “pattern matching” analysis, such as bite-mark, tire-tread or carpet-fiber analysis, there are no statistics that analysts can produce to back up their testimony. We simply don’t know how many other guns could have created similar markings. Instead, the jury is simply asked to rely on the witness’s expertise about a match."
As noted in the previous post, the "pattern matching" comparisons are prone to error when an appropriate sample size is not used as a control.
The issue, as far as statistics are concerned, is not necessarily the observations of the analyst but the conclusions. Without an appropriate sample, how does one know where the observed results would fall within a normal distribution? Are the results one is observing "typical" or "unique?" How you would know? You would construct a valid test.
Balko's point? No one seems to be doing this - conducting valid tests. Well, almost no one. I certainly do - conduct valid tests, that is.
If you're interested in what I'm talking about and want to learn more about calculating sample sizes and comparing observed results, sign up today for Statistics for Forensic Analysts (link).
Have a great weekend, my friends.
Showing posts sorted by date for query sample size. Sort by relevance Show all posts
Showing posts sorted by date for query sample size. Sort by relevance Show all posts
Saturday, February 29, 2020


Tuesday, February 25, 2020
Sample Size? Who needs an appropriate sample?
Last year, I spent a lot of time talking about statistics and the need for analysts to understand this important science. Ive written a lot about the need for appropriate samples, especially around the idea of supporting a determination of "match" or "identification."
Many in the discipline have responded essentially saying, it is what it is - we don't really need to know about these topics or incorporate these concepts in our practice.
Now comes a new study from Sophie J. Nightingale and Hany Farid, Assessing the reliability of a clothing-based forensic identification. If you've been to one of my Content Analysis classes, or one of my Advanced Processing Techniques sessions, reading the new study won't yield much new information from a conceptual standpoint. It will, however, lend a bunch of new data affirming the need for appropriate samples and methods when conducting work in the forensic sciences.
From the new study: "Our justice system relies critically on the use of forensic science. More than a decade ago, a highly critical report raised significant concerns as to the reliability of many forensic techniques. These concerns persist today. Of particular concern to us is the use of photographic pattern analysis that attempts to identify an individual from purportedly distinct features. Such techniques have been used extensively in the courts over the past half century without, in our opinion, proper validation. We propose, therefore, that a large class of these forensic techniques should be subjected to rigorous analysis to determine their efficacy and appropriateness in the identification of individuals."
The important thing about the study is that the authors collected an appropriate set of samples to conduct their analysis.
Check it out and see what I mean. Notice how the results develop from the samples collected. See how they differ from an examination of a single image. Thus, I always say, under a certain sample size, you're better off flipping a coin.
If, after reading the paper, you're interested in increasing your knowledge of statistics and experimental science, feel free to sign-up for Statistics for Forensic Analysts.
Have a great day, my friends.
Many in the discipline have responded essentially saying, it is what it is - we don't really need to know about these topics or incorporate these concepts in our practice.
Now comes a new study from Sophie J. Nightingale and Hany Farid, Assessing the reliability of a clothing-based forensic identification. If you've been to one of my Content Analysis classes, or one of my Advanced Processing Techniques sessions, reading the new study won't yield much new information from a conceptual standpoint. It will, however, lend a bunch of new data affirming the need for appropriate samples and methods when conducting work in the forensic sciences.
From the new study: "Our justice system relies critically on the use of forensic science. More than a decade ago, a highly critical report raised significant concerns as to the reliability of many forensic techniques. These concerns persist today. Of particular concern to us is the use of photographic pattern analysis that attempts to identify an individual from purportedly distinct features. Such techniques have been used extensively in the courts over the past half century without, in our opinion, proper validation. We propose, therefore, that a large class of these forensic techniques should be subjected to rigorous analysis to determine their efficacy and appropriateness in the identification of individuals."
The important thing about the study is that the authors collected an appropriate set of samples to conduct their analysis.
Check it out and see what I mean. Notice how the results develop from the samples collected. See how they differ from an examination of a single image. Thus, I always say, under a certain sample size, you're better off flipping a coin.
If, after reading the paper, you're interested in increasing your knowledge of statistics and experimental science, feel free to sign-up for Statistics for Forensic Analysts.
Have a great day, my friends.
Wednesday, August 7, 2019
Where'd you get the 10?
When the "Search for Images on the Web" functionality was introduced into Amped's Authenticate some time ago, I asked a simple question of the development team, "where'd you get the 10?"

Amped SRL prides itself on operationalizing peer-reviewed published papers in image science. I assumed, wrongly it seems, that there was some science behind the UI's default setting for how many pictures you'd like to find. There isn't.
What I found out, at the time, is that the "Stop After Finding At Least N Pictures. N is" default of 10 is set to 10 for no particular reason whatsoever. My own opinion is that it's set to 10 because the developers are engineers and 10 - a one and a zero - looks nice. The 10 has no foundation in science / statistics as a valid number for that field. If you accept the default as presented, you're creating a convenience sample set that will give you more chances of being wrong than being right. Here's why.
The basic question being tested in the developer's example, with help from the "Search Images From Same Camera Model" dialog, is "match / no match." Does the evidence item match a representative sample of images from the same make / model of camera? You would perform this check when your evidence item's JPEG QT is not found in your tool's internal database (this is a known limitation of all software that is dependent upon an internal database). Another way of framing "match / no match" is a Generic Binomial Test.
Here's what the sample size calculation looks like for a generic binomial test performed in the criminal justice context (as opposed to the university / research context).
A two-tailed test has a better ability to limit Type I and Type II errors vs. a one-tailed test. α and β error probability are set as low as possible, one chance per 100. This protocol yields a recommended sample size of 59. Not 10.

Around 20 samples, you have more chances of being wrong than being right. At 10 samples, you have about 8 chances in 10 of being wrong.
The "match / no match" scenario is quite different than an attempt to establish "ground truth," or what the camera "should be producing" when it creates an image. For these tests, a "performance model" is required and is generated by samples created by the device in question. Each camera will present it's own issues and the results of your test of the camera in question can't be applied to other cameras of the same make / model. You'll need to know a bit about the signal path - from light coming in to the resulting image's storage - to be able to determine the correct value for the "predictors" variable. In my last experiment, that value was 17 ... 17 different parts / processes that could possibly be in error. In that case, the sample size calculation was as shown below.
In this case, I needed to generate 164 valid files for my sample set - not 10. The plot is shown below.

With only 10 samples for such a test, you would have 9 chances in 10 of being wrong.
Another scenario where the "official guidance" on sample sizes is quite off is with PRNU. The official guidance notes that the number of reference images in building a reference pattern is limited to 50, "(the number of images is limited to 50, which proved to be enough – we’ll also discuss this in a future post)." But, from the source documentation (link), the authors recommend more than that, "Obviously, the larger the number of images Np, the more we suppress random noise components and the impact of the scene. "Based on our experiments, we recommend using Np > 50" (link). The authors of the source document actually used 320 samples per camera in proving out their theories - not 10 or 50. Other researchers examining PRNU have used even larger sample sets (link) (link). These three links weren't chosen at random to attempt to reinforce my point. These are the references found in the processing report generated by Amped's Authenticate - further illustrating the point about validation of tools and methodologies. (Many thanks to Dr. Fridrich for maintaining a massive list of source documentation.)

But, as my old college football coach used to say, "the wrong way will work some of the time, the right way will work all of the time." Simply choosing a convenient number of samples may not be a problem in a justice system that has a 95% plea rate. But, as recent news points out, if you get caught out for bad methodology, all of your past work gets re-opened. Don't let this happen to you. Use sound methods. Get educated on the foundations of your work.
Remember, tools like Amped SRL's Authenticate don't render an opinion as to a file's authenticity - you do. Your opinion must be backed by a sound methodology, compliance with standards, and the fundamentals of science.
Correcting the lack of understanding of this vital topic was on the 2009 NAS Report's list of recommendations (link).
"The issues covered during the committee’s hearings and deliberations included:

Amped SRL prides itself on operationalizing peer-reviewed published papers in image science. I assumed, wrongly it seems, that there was some science behind the UI's default setting for how many pictures you'd like to find. There isn't.
What I found out, at the time, is that the "Stop After Finding At Least N Pictures. N is" default of 10 is set to 10 for no particular reason whatsoever. My own opinion is that it's set to 10 because the developers are engineers and 10 - a one and a zero - looks nice. The 10 has no foundation in science / statistics as a valid number for that field. If you accept the default as presented, you're creating a convenience sample set that will give you more chances of being wrong than being right. Here's why.
The basic question being tested in the developer's example, with help from the "Search Images From Same Camera Model" dialog, is "match / no match." Does the evidence item match a representative sample of images from the same make / model of camera? You would perform this check when your evidence item's JPEG QT is not found in your tool's internal database (this is a known limitation of all software that is dependent upon an internal database). Another way of framing "match / no match" is a Generic Binomial Test.
Here's what the sample size calculation looks like for a generic binomial test performed in the criminal justice context (as opposed to the university / research context).
Analysis: A priori: Compute required sample size
Input: Tail(s) = Two
Proportion p2 = 0.8
α err prob = 0.01
Power (1-β err prob) = 0.99
Proportion p1 = 0.5
Output: Lower critical N = 19.0000000
Upper critical N = 40.0000000
Total sample size = 59
Actual power = 0.9912792
Actual α = 0.0086415
A two-tailed test has a better ability to limit Type I and Type II errors vs. a one-tailed test. α and β error probability are set as low as possible, one chance per 100. This protocol yields a recommended sample size of 59. Not 10.

Around 20 samples, you have more chances of being wrong than being right. At 10 samples, you have about 8 chances in 10 of being wrong.
The "match / no match" scenario is quite different than an attempt to establish "ground truth," or what the camera "should be producing" when it creates an image. For these tests, a "performance model" is required and is generated by samples created by the device in question. Each camera will present it's own issues and the results of your test of the camera in question can't be applied to other cameras of the same make / model. You'll need to know a bit about the signal path - from light coming in to the resulting image's storage - to be able to determine the correct value for the "predictors" variable. In my last experiment, that value was 17 ... 17 different parts / processes that could possibly be in error. In that case, the sample size calculation was as shown below.
t tests - Linear multiple regression: Fixed model, single regression coefficient
Analysis: A priori: Compute required sample size
Input: Tail(s) = Two
Effect size f² = 0.15
α err prob = 0.01
Power (1-β err prob) = 0.99
Number of predictors = 17
Output: Noncentrality parameter δ = 4.9598387
Critical t = 2.6099227
Df = 146
Total sample size = 164
Actual power = 0.9900250
In this case, I needed to generate 164 valid files for my sample set - not 10. The plot is shown below.

With only 10 samples for such a test, you would have 9 chances in 10 of being wrong.
Another scenario where the "official guidance" on sample sizes is quite off is with PRNU. The official guidance notes that the number of reference images in building a reference pattern is limited to 50, "(the number of images is limited to 50, which proved to be enough – we’ll also discuss this in a future post)." But, from the source documentation (link), the authors recommend more than that, "Obviously, the larger the number of images Np, the more we suppress random noise components and the impact of the scene. "Based on our experiments, we recommend using Np > 50" (link). The authors of the source document actually used 320 samples per camera in proving out their theories - not 10 or 50. Other researchers examining PRNU have used even larger sample sets (link) (link). These three links weren't chosen at random to attempt to reinforce my point. These are the references found in the processing report generated by Amped's Authenticate - further illustrating the point about validation of tools and methodologies. (Many thanks to Dr. Fridrich for maintaining a massive list of source documentation.)

But, as my old college football coach used to say, "the wrong way will work some of the time, the right way will work all of the time." Simply choosing a convenient number of samples may not be a problem in a justice system that has a 95% plea rate. But, as recent news points out, if you get caught out for bad methodology, all of your past work gets re-opened. Don't let this happen to you. Use sound methods. Get educated on the foundations of your work.
Remember, tools like Amped SRL's Authenticate don't render an opinion as to a file's authenticity - you do. Your opinion must be backed by a sound methodology, compliance with standards, and the fundamentals of science.
Correcting the lack of understanding of this vital topic was on the 2009 NAS Report's list of recommendations (link).
"The issues covered during the committee’s hearings and deliberations included:
- (a) the fundamentals of the scientific method as applied to forensic practice—hypothesis generation and testing, falsifiability and replication, and peer review of scientific publications;
- (b) the assessment of forensic methods and technologies—the collection and analysis of forensic data; accuracy and error rates of forensic analyses; sources of potential bias and human error in interpretation by forensic experts; and proficiency testing of forensic experts;
- (c) infrastructure and needs for basic research and technology assessment in forensic science
- (d) current training and education in forensic science; ..." pg. 3
10 years later, and vendors are still ignoring the NAS' recommendations, often providing incorrect information to customers.
The scientific method forms the foundation of all of the forensic science training offerings that I've created over the years. Illustrating error rates, where they appear in the work, and how to calculate and control for them can be found in all of our forensic science courses.
If you'd like to move beyond "push-button forensics," I hope to see you in class soon.
Wednesday, July 24, 2019
SWGDE Core Technical Concepts for Time-Based Analysis of Digital Video Files - draft for public comment
Continuing on from yesterday's post, let's examine SWGDE Core Technical Concepts for Time-Based Analysis of Digital Video Files. I'd like to share with you, the reader, what I shared with the SWGDE Secretary.
My primary concern with this document is the irrational switch from “what is” (e.g., the data in the container), to “what it should be” (e.g., the data’s relationship to previous events). As a document for examining the data in the container, this document is a good treatment of the relevant time code standards. As a document for attempting to link the data in the container to a previous event, it is quite lacking in scientific foundation. I will illustrate my points below.
Page 4 - Current Text:
“This document does not address the process by which images are captured, sampled, and/or encoded; it focuses on the interpretation of data once it has been encoded into a binary format.”
Issue:
The interpretation of the data, the procedure necessary to attempt to link the data in the container to a previous event, is not actually described in this document. The document assumes that what is in the container is “ground truth,” but that cannot be assumed and must be established through testing. Thus, the correct word of the focus is “reporting,” and not “interpretation.” Nothing in this document could be used to inform a conclusion that is founded in experimental science. Conclusions, opinion based testimony, are the results of analysis / experimentation, which is not the focus of this guide.
Page 4 - Current Text:
“Determining the frame timing within a video file has several applications and may be particularly helpful in determining the accuracy of an unknown variable during an event of interest."
Issue:
The document describes the various time code types that may be present in a data container. Finding and reporting this data with valid tools is not a “determination” in the scientific sense, but a reporting of what is contained in the output of specific reporting processes.
Thus, the correct verb is “report,” and not “determine." Determinations, (aka conclusions), are opinion based and are thus the results of analysis / experimentation, which is not the focus of this guide.
Current Text:
“Digital video containers and encoding formats define methods to encode timing information within binary streams or packages. Proper decoding of timing information is critical for the ability of software to provide accurate playback of digital video.”
Issue:
A “proper decoding of timing information” assumes that a “proper” encoding of the information happened in the creation of the evidence file. The evidence file is a sample of 1, and until / unless a baseline or ground truth of the range of timing behavior of the recording device is established through a valid and reliable experiment, there is no way of knowing what is “proper.” If one seeks to link the timing of the video playback to previous events, one must build a performance model of the capture device. Given the nature of DVR manufacturing and the Just in Time manufacturing model that the majority of the DVR manufacturers employ, this procedure can not be generalized from the results of tests of a single DVR, rather each DVR’s performance must be modeled.
Experimental Design
It’s a fundamental principle of experimental science that one can only measure “now.” To attempt to link “now” to “then,” in any direction of time, one must predict by designing, testing, validating, and implementing a prediction model. This is certainly possible to do with DVRs and frame timing via multiple logistic regression. In this way, all of the variables can be controlled and a range of values computed.
If you were conducting research and comfortable with an error probability of .05 on both ends (Type 1 / Type 2), then the protocol for the sample size calculation would look like that shown below (controlling only for the number of camera views and not for the various data choke points, and etc):
t tests - Linear multiple regression: Fixed model, single regression coefficient
Analysis: A priori: Compute required sample size
Input: Tail(s) = Two
Effect size f² = 0.15
α err prob = 0.05
Power (1-β err prob) = 0.95
Number of predictors = 16
Output: Noncentrality parameter δ = 3.6742346
Critical t = 1.9929971
Df = 73
Total sample size = 90
Actual power = 0.9520952
If you were conducting this test in a criminal justice proceeding, the error probability should be lower: .01 on both ends (Type 1 / Type 2). The protocol for the sample size calculation would look like that shown below (controlling only for the number of camera views and not for the various data choke points, and etc):
t tests - Linear multiple regression: Fixed model, single regression coefficient
Analysis: A priori: Compute required sample size
Input: Tail(s) = Two
Effect size f² = 0.15
α err prob = 0.01
Power (1-β err prob) = 0.99
Number of predictors = 16
Output: Noncentrality parameter δ = 4.9598387
Critical t = 2.6096879
Df = 147
Total sample size = 164
Actual power = 0.9900354
Given the sample sizes involved, if SWGDE intended to guide the practitioner in building a performance model of the source DVR, the guidance should note the difference in Power between the two samples. Nevertheless, the appropriate sample size (the amount of complete tests necessary to produce your range of frame rate values) is between 90 and 160 (as computed above).
Reporting
Once the requisite number of tests (samples) have been calculated, the results will be given as a range of values and not a single number. This range could then inform a speed calculation, which will also result in a range of possible values.
Limitations
Given the manufacturing process, there will be several failures in the test phase. These should be noted. Additionally, the total number of samples should only include completed tests that generated valid data. This will likely increase the number of attempts by +/- 5%.
Our tests in this area have shown that there is a small variability in timing when the file is meant to represent 1 minute of real time. However, when the file is mean to represent more than 30 minutes, as is often the case in DVR files, the minute to minute variability is actually quite large. Thus, the experiment should attempt to replicate the data generation conditions of the evidence source.
Current Text:
“Commercial or open source tools are available to aid in the determination of speed, duration, and timing of events captured on video for both investigative and forensic examinations in civil and criminal litigation. For example, a frame information report can be generated with FFmpeg (See SWGDE Technical Notes on FFmpeg, Section 11.3).”
Issue:
As noted above, the frame information report generated with FFmpeg is just a “report” of what’s in the container, not a “determination” of any kind.
As a final point, the document references SWGDE Technical Notes on FFmpeg, which I will address in the next post.
As always, if you care to comment, please do so (politely) below.
My primary concern with this document is the irrational switch from “what is” (e.g., the data in the container), to “what it should be” (e.g., the data’s relationship to previous events). As a document for examining the data in the container, this document is a good treatment of the relevant time code standards. As a document for attempting to link the data in the container to a previous event, it is quite lacking in scientific foundation. I will illustrate my points below.
Page 4 - Current Text:
“This document does not address the process by which images are captured, sampled, and/or encoded; it focuses on the interpretation of data once it has been encoded into a binary format.”
Issue:
The interpretation of the data, the procedure necessary to attempt to link the data in the container to a previous event, is not actually described in this document. The document assumes that what is in the container is “ground truth,” but that cannot be assumed and must be established through testing. Thus, the correct word of the focus is “reporting,” and not “interpretation.” Nothing in this document could be used to inform a conclusion that is founded in experimental science. Conclusions, opinion based testimony, are the results of analysis / experimentation, which is not the focus of this guide.
Page 4 - Current Text:
“Determining the frame timing within a video file has several applications and may be particularly helpful in determining the accuracy of an unknown variable during an event of interest."
Issue:
The document describes the various time code types that may be present in a data container. Finding and reporting this data with valid tools is not a “determination” in the scientific sense, but a reporting of what is contained in the output of specific reporting processes.
Thus, the correct verb is “report,” and not “determine." Determinations, (aka conclusions), are opinion based and are thus the results of analysis / experimentation, which is not the focus of this guide.
Current Text:
“Digital video containers and encoding formats define methods to encode timing information within binary streams or packages. Proper decoding of timing information is critical for the ability of software to provide accurate playback of digital video.”
Issue:
A “proper decoding of timing information” assumes that a “proper” encoding of the information happened in the creation of the evidence file. The evidence file is a sample of 1, and until / unless a baseline or ground truth of the range of timing behavior of the recording device is established through a valid and reliable experiment, there is no way of knowing what is “proper.” If one seeks to link the timing of the video playback to previous events, one must build a performance model of the capture device. Given the nature of DVR manufacturing and the Just in Time manufacturing model that the majority of the DVR manufacturers employ, this procedure can not be generalized from the results of tests of a single DVR, rather each DVR’s performance must be modeled.
Experimental Design
It’s a fundamental principle of experimental science that one can only measure “now.” To attempt to link “now” to “then,” in any direction of time, one must predict by designing, testing, validating, and implementing a prediction model. This is certainly possible to do with DVRs and frame timing via multiple logistic regression. In this way, all of the variables can be controlled and a range of values computed.
If you were conducting research and comfortable with an error probability of .05 on both ends (Type 1 / Type 2), then the protocol for the sample size calculation would look like that shown below (controlling only for the number of camera views and not for the various data choke points, and etc):
t tests - Linear multiple regression: Fixed model, single regression coefficient
Analysis: A priori: Compute required sample size
Input: Tail(s) = Two
Effect size f² = 0.15
α err prob = 0.05
Power (1-β err prob) = 0.95
Number of predictors = 16
Output: Noncentrality parameter δ = 3.6742346
Critical t = 1.9929971
Df = 73
Total sample size = 90
Actual power = 0.9520952
If you were conducting this test in a criminal justice proceeding, the error probability should be lower: .01 on both ends (Type 1 / Type 2). The protocol for the sample size calculation would look like that shown below (controlling only for the number of camera views and not for the various data choke points, and etc):
t tests - Linear multiple regression: Fixed model, single regression coefficient
Analysis: A priori: Compute required sample size
Input: Tail(s) = Two
Effect size f² = 0.15
α err prob = 0.01
Power (1-β err prob) = 0.99
Number of predictors = 16
Output: Noncentrality parameter δ = 4.9598387
Critical t = 2.6096879
Df = 147
Total sample size = 164
Actual power = 0.9900354
Given the sample sizes involved, if SWGDE intended to guide the practitioner in building a performance model of the source DVR, the guidance should note the difference in Power between the two samples. Nevertheless, the appropriate sample size (the amount of complete tests necessary to produce your range of frame rate values) is between 90 and 160 (as computed above).
Reporting
Once the requisite number of tests (samples) have been calculated, the results will be given as a range of values and not a single number. This range could then inform a speed calculation, which will also result in a range of possible values.
Limitations
Given the manufacturing process, there will be several failures in the test phase. These should be noted. Additionally, the total number of samples should only include completed tests that generated valid data. This will likely increase the number of attempts by +/- 5%.
Our tests in this area have shown that there is a small variability in timing when the file is meant to represent 1 minute of real time. However, when the file is mean to represent more than 30 minutes, as is often the case in DVR files, the minute to minute variability is actually quite large. Thus, the experiment should attempt to replicate the data generation conditions of the evidence source.
Current Text:
“Commercial or open source tools are available to aid in the determination of speed, duration, and timing of events captured on video for both investigative and forensic examinations in civil and criminal litigation. For example, a frame information report can be generated with FFmpeg (See SWGDE Technical Notes on FFmpeg, Section 11.3).”
Issue:
As noted above, the frame information report generated with FFmpeg is just a “report” of what’s in the container, not a “determination” of any kind.
As a final point, the document references SWGDE Technical Notes on FFmpeg, which I will address in the next post.
As always, if you care to comment, please do so (politely) below.
Tuesday, July 23, 2019
SWGDE Best Practice for Frame Timing Analysis of Video Stored in ISO Base Media File Formats - draft for public comment
In case you missed it, SWGDE released several drafts for public comment. Ordinarily, I review the ones that pertain to the disciplines in which I'm engaged and offer comments where necessary. However, in the last year or so, the communication has been rather one-directional. I've not heard back that my comments were received or considered. Neither did my suggestions make it into the published version. Thus, given the lack of communication and transparency (more on that in a future post), I'm going to publish my comments here for each of the drafts, as well as submitting them to the SWGDE secretary.
We'll start with SWGDE Best Practice for Frame Timing Analysis of Video Stored in ISO Base Media File Formats.
My first issue with this document can be found in pages 4 - 8. Throughout these sections, the word / process “determine” is used. Given the guidance provided, this is the incorrect verb. To "determine" is to ascertain or establish exactly, typically as a result of research or calculation. No calculation method is provided in this document. No experimentation is recommended.
The document describes wherein various sections of an output report from ffmpeg one can find information. This is not a “determination” in a scientific sense, but a reporting of what is contained in the output report of specific processes.
Thus, the correct verb is “report,” and not "determine." This is supported by the Scope statement that the guidance is not intended to be used to inform a conclusion. Conclusions, opinion based testimony, are the results of analysis / experimentation, which is not the focus of this guide.
Given the Scope statement, and the fact that one is simply reporting the information in the container, and not establishing the “ground truth” of time, the I've suggested a complete elimination of the statement found in Limitations statement, "The concepts in this document may be used as part of investigations into determining object speed in recorded video." A reported time is not appropriate in a speed calculation. A determined time, established via experimentation (as explained below) may be used - but this document does not describe a valid experimental process for establishing the accuracy of the information in the data container.
My second issue deals with Section 8 and 9.
Experimental Design
It’s a fundamental principle of experimental science that one can only measure “now.” For “then,” in any direction of time, one must predict by designing, testing, validating, and implementing a prediction model. This is certainly possible to do with DVRs and frame timing via multiple logistic regression. In this way, all of the variables can be controlled and a range of values computed.
If you were conducting research and comfortable with an error probability of .05 on both ends (Type 1 / Type 2), then the protocol for the sample size calculation would look like this (controlling only for the number of camera views and not for the various data choke points, and etc):
t tests - Linear multiple regression: Fixed model, single regression coefficient
Analysis: A priori: Compute required sample size
Input: Tail(s) = Two
Effect size f² = 0.15
α err prob = 0.05
Power (1-β err prob) = 0.95
Number of predictors = 16
Output: Noncentrality parameter δ = 3.6742346
Critical t = 1.9929971
Df = 73
Total sample size = 90
Actual power = 0.9520952
If you were conducting this test in a criminal justice proceeding, the error probability should be lower: .01 on both ends (Type 1 / Type 2). The protocol for the sample size calculation would look like this (controlling only for the number of camera views and not for the various data choke points, and etc):
t tests - Linear multiple regression: Fixed model, single regression coefficient
Analysis: A priori: Compute required sample size
Input: Tail(s) = Two
Effect size f² = 0.15
α err prob = 0.01
Power (1-β err prob) = 0.99
Number of predictors = 16
Output: Noncentrality parameter δ = 4.9598387
Critical t = 2.6096879
Df = 147
Total sample size = 164
Actual power = 0.9900354
Given the sample sizes involved, the guidance should note the difference in Power between the two samples. Nevertheless, the appropriate sample size (the amount of complete tests necessary to produce your range of frame rate values) is between 90 and 160 (as computed above).
With a sample size of 5, as illustrated in the document, the analyst has more chances of being wrong about frame timing than being right.
Reporting
Once the requisite number of tests have been conducted, the results will be given as a range of values and not a single number. This range will then inform a speed calculation, which will also result in a range of possible values.
Limitations
Given the manufacturing process, there will be several failures in the test phase. These should be noted. Additionally, the total number of samples should only includ completed tests that generated valid data. This will likely increase the number of attempts by +/- 5%.
Our tests in this area have shown that there is a small variability in timing when the file is meant to represent 1 minute of real time. However, when the file is mean to represent more than 30 minutes, as is often the case in DVR files, the minute to minute variability is actually quite large. Thus, the experiment should attempt to replicate the data generation conditions of the evidence source.
Conclusion
I certainly hope that the SWGDE membership consider my comments. Again, I've submitted them via email to the SWGDE secretary, providing the requisite information.
I invite your comments below on what I've presented.
We'll start with SWGDE Best Practice for Frame Timing Analysis of Video Stored in ISO Base Media File Formats.
My first issue with this document can be found in pages 4 - 8. Throughout these sections, the word / process “determine” is used. Given the guidance provided, this is the incorrect verb. To "determine" is to ascertain or establish exactly, typically as a result of research or calculation. No calculation method is provided in this document. No experimentation is recommended.
The document describes wherein various sections of an output report from ffmpeg one can find information. This is not a “determination” in a scientific sense, but a reporting of what is contained in the output report of specific processes.
Thus, the correct verb is “report,” and not "determine." This is supported by the Scope statement that the guidance is not intended to be used to inform a conclusion. Conclusions, opinion based testimony, are the results of analysis / experimentation, which is not the focus of this guide.
Given the Scope statement, and the fact that one is simply reporting the information in the container, and not establishing the “ground truth” of time, the I've suggested a complete elimination of the statement found in Limitations statement, "The concepts in this document may be used as part of investigations into determining object speed in recorded video." A reported time is not appropriate in a speed calculation. A determined time, established via experimentation (as explained below) may be used - but this document does not describe a valid experimental process for establishing the accuracy of the information in the data container.
My second issue deals with Section 8 and 9.
Experimental Design
It’s a fundamental principle of experimental science that one can only measure “now.” For “then,” in any direction of time, one must predict by designing, testing, validating, and implementing a prediction model. This is certainly possible to do with DVRs and frame timing via multiple logistic regression. In this way, all of the variables can be controlled and a range of values computed.
If you were conducting research and comfortable with an error probability of .05 on both ends (Type 1 / Type 2), then the protocol for the sample size calculation would look like this (controlling only for the number of camera views and not for the various data choke points, and etc):
t tests - Linear multiple regression: Fixed model, single regression coefficient
Analysis: A priori: Compute required sample size
Input: Tail(s) = Two
Effect size f² = 0.15
α err prob = 0.05
Power (1-β err prob) = 0.95
Number of predictors = 16
Output: Noncentrality parameter δ = 3.6742346
Critical t = 1.9929971
Df = 73
Total sample size = 90
Actual power = 0.9520952
If you were conducting this test in a criminal justice proceeding, the error probability should be lower: .01 on both ends (Type 1 / Type 2). The protocol for the sample size calculation would look like this (controlling only for the number of camera views and not for the various data choke points, and etc):
t tests - Linear multiple regression: Fixed model, single regression coefficient
Analysis: A priori: Compute required sample size
Input: Tail(s) = Two
Effect size f² = 0.15
α err prob = 0.01
Power (1-β err prob) = 0.99
Number of predictors = 16
Output: Noncentrality parameter δ = 4.9598387
Critical t = 2.6096879
Df = 147
Total sample size = 164
Actual power = 0.9900354
Given the sample sizes involved, the guidance should note the difference in Power between the two samples. Nevertheless, the appropriate sample size (the amount of complete tests necessary to produce your range of frame rate values) is between 90 and 160 (as computed above).
With a sample size of 5, as illustrated in the document, the analyst has more chances of being wrong about frame timing than being right.
Reporting
Once the requisite number of tests have been conducted, the results will be given as a range of values and not a single number. This range will then inform a speed calculation, which will also result in a range of possible values.
Limitations
Given the manufacturing process, there will be several failures in the test phase. These should be noted. Additionally, the total number of samples should only includ completed tests that generated valid data. This will likely increase the number of attempts by +/- 5%.
Our tests in this area have shown that there is a small variability in timing when the file is meant to represent 1 minute of real time. However, when the file is mean to represent more than 30 minutes, as is often the case in DVR files, the minute to minute variability is actually quite large. Thus, the experiment should attempt to replicate the data generation conditions of the evidence source.
Conclusion
I certainly hope that the SWGDE membership consider my comments. Again, I've submitted them via email to the SWGDE secretary, providing the requisite information.
I invite your comments below on what I've presented.
Monday, May 27, 2019
When the data supports no conclusion, just say so
I can't quantify the amount of requests I've received over the years where investigators have asked me to resolve a few pixels or blocks into a license plate or other identifying item. If, at the Content Triage step, nominal resolution isn't sufficient to answer the question, I say so.
When the data supports no conclusion, I try to quantify why. I usually note the nominal resolution and / or the particular defect that may be getting in the way - blur, obstruction, etc. What I don't do is equivocate. Quite the opposite, I try to be very specific as to why the question can't be answered. In this way, there is no ambiguity in my conclusion(s).
Additionally, whomever is responsible for the source of the evidence will have insight as to potential improvements to the situation. For example, if the question is "what is license plate," and the camera is positioned to monitor a parking lot, then the person / company responsible for the security infrastructure can be alerted to the potential need for additional coverage in the area of interest. This could mean additional cameras, or a change in lensing, or ...
Why this topic today?
I received a link to this article in my inbox. "Expert says Merritt truck ‘cannot be excluded’ as vehicle on McStay neighborhood video." Really? "Cannot be excluded?" What does, "cannot be excluded" mean?
At issue is a 2000 Chevy work truck, similar to the one below. Chevy makes some of the most popular trucks in the US, second only to Ford. This case takes place in Southern California, home to more than 20m people from Kern to San Diego counties.

"Cannot be excluded" is not a conclusion, it's an equivocation. Search CarFax.com for used Chevy Silverado 3500 HD trucks for sale within a 100 mile radius of Fallbrook, CA (92028). I did. I found 49 trucks for sale on that site. 49 trucks that "cannot be excluded" ... AutoTrader listed 277 trucks for sale. 277 more trucks that "cannot be excluded" ...
All of this requires us to ask a question, is the goal of a comparative analysis to "exclude" or to "include?" How would you know if you've never taken a course in comparative analysis? Perhaps we can start with the SWGDE Best Practices for Photographic Comparison for All Disciplines. Version: 1.1 (July 18, 2017) (link):
Class Characteristic – A feature of an object that is common to a group of objects.
Individualizing Characteristic – A feature of an object that contributes to differentiating that object from others of its class.
5.2 Examine the photographs to determine if they are sufficient quality to complete an examination, and if the quality will have an effect on the degree to which an examination can be completed. Specific disciplines should define quality criteria, when possible, and how a failure to meet the specified quality criterion will impact results. (This may apply to a portion of the image, or the image as a whole.)
5.2.1 If the specified quality criteria are not met, determine if it is possible to obtain additional images. If the specified quality criteria are not met, and additional images cannot be obtained, this may preclude the examiner from conducting an examination, or the results of the examination may be limited.
5.3 Enhance images as necessary. Refer to ASTM Guide E2825 for Forensic Digital Image Processing.
These steps are the essence of the Content Triage step in the workflow - do I have enough nominal resolution to continue processing and reach a conclusion?
But, there is more to this process than just a comparison of a "known" and an "unknown." How does one go from "unknown" to a "known" for a comparison? How do you "know" what is "known?" First, you must attempt a Vehicle Make / Model Determination of the vehicle in the CCTV footage.
For a Vehicle Make / Model Determination, the SWGDE Vehicle Make/Model Comparison Form. Version: 1.0 (July 11, 2018) (source) is quite helpful.
How many features are shared between model years in a specific manufacturer's product line? Class Characteristics can help get you to "truck," then to "work truck" (presence of exterior cargo containers not typically present in a basic pickup truck), then to "make" based on shapes and positions of features of the items found in the Comparison form. The form can be used to document your findings.
You may get to Make, but getting to Model in low resolution images and video can be frustrating. What's the difference between a Chevy Silverado 1500, 1500LD, 2500HD, 3500HD? There are more than 10 trim variations of the 1500 series alone. What's the difference between a 2500HD and a 3500HD?
After you've documented your process of going from "object" to "work truck" to a specific model of work truck, how do you move beyond class, to make, to model, to year, to a specific truck? Remember, an Individualizing Characteristic is a feature of an object that contributes to differentiating that object from others of its class. Before you say "headlight spread pattern," please know that there is no valid research supporting "headlight spread pattern" as an individualizing characteristic - NONE. I know that there are cases where this technique has been used, but rhetoric is not science. Many jurisdictions, such as California and Georgia, will allow just about everything in at trial, so not having one's testimony excluded at trial is not proof of anything scientific.
Taking your CCTV footage, you've made your make / model / year determination using the SWGDE's form. Now, how do you move to an individual truck?
This is where basic statistics and inferential reasoning are quite necessary. Do you have sufficient nominal resolution to pick out identifying characteristics in the footage? If not, you're done. The data supports no conclusion as to individualization.
But assuming that you do, how do you work scientifically and as bias free as possible? Unpack the biasing information that you received from your "client" and design an experiment. In the US, given our Constitutional provisions that the accused are innocent until proven guilty, it is for the prosecution to prove guilt. Thus, the staring point for your experiment is that the truck in question is not a match. With sufficient nominal resolution, you set about to prove that there is a match. If you can't, there is no match as far as you're concerned. Remember, the comparative analysis should not be influenced by any other factors or items of evidence.
In designing the experiment, you'll need a sample set of images. You see, a simple "match / no match" comparison needs an adequate sample. It perverts the course of justice to simply attempt the comparison on the accused's vehicle. We don't do witness ID line-ups with just the suspect. Neither should anyone attempt a comparison with just a single "unknown" image - the accused's. Yes, I do use this specific provision of English Common Law to explain the problem here. Perverting the Course of Justice can be any of three acts, fabricating or disposing of evidence, intimidating or threatening a witness or juror, intimidating or threatening a judge. In this case, one Perverts the Course of Justice when one fabricates a conclusion (scientific evidence) where none is possible.
Back to the experiment. How many "unknown" images would you need to approach 99% confidence in your results, thus assisting the course of justice? Answer = 52. How did I come up with 52?
Exact - • Generic binomial test
Analysis: A priori: Compute required sample size
Input: Tail(s) = One
Proportion p2 = 0.8
α err prob = 0.01
Power (1-β err prob) = .99
Proportion p1 = 0.5
Output: Lower critical N = 35.0000000
Upper critical N = 35.0000000
Total sample size = 52
Actual power = 0.9901396
Actual α = 0.008766618
A generic binomial test is similar to the flip of a coin - only two possible outcomes, heads / tails or match / no match. It's the simplest test to perform.

The error probability is your chance of being wrong. At 52 test images, you've got a 1 in 100 chance of being wrong (.99). As you move below 15 test images, you have a greater chance of being wrong than being right. With a sample size of 1, you're likely more accurate tossing a coin.
The 52 samples help us to get to make / model / year. You may chose to refresh those samples with new ones to perform a "blind comparison," and attempt to "include" the suspect's vehicle in your findings. To do this, you'd need the specific description of the "known" vehicle that makes it unique vs the others in the sample.
If I were performing a make / model / year determination, and then a comparison, I would note any errors or limitations in my report. If the data supported no conclusion, or if the limitations in the data prevented me from arriving at a determination, I would note that the data supported no conclusion. If I was able to make a determination, I would have noted my process and how I arrived at the conclusion (in a reliable, valid, and reproducible fashion).
The problem with the reporting of the case is the "cannot be excluded" portion is in the headline. One has to read deeper into the article to find, "... Liscio denied (that his conclusions may have been formed to fit the bias of the prosecution, who was paying him...), and reminded McGee more than once that he had not identified the truck specifically as Merritt’s..."
Which requires another question be asked, if the analyst had not identified the vehicle, what was he doing there in testimony?
"Among the items that helped to reach the conclusion that the vehicle was “consistent” with Merritt’s truck was a glint caught by the video that matched the position of a latch on a passenger-side storage box toward the rear of the truck, said Liscio,who uses 3D imagery."
Here we move from "cannot be excluded" to "consistent with," another equivocation. How does one not identify a vehicle, but find that said unknown vehicle is "consistent with" the "known" vehicle? This is the problem with Demonstrative Comparisons. When you place a single "known" against a single "unknown" in a demonstrative exhibit, you are making a choice as to what to include in your exhibit - thus you have concluded.
Back to the demonstrative. What is it about the latch on the side of the truck that is unique? Won't all work trucks of this type have latches on their cargo containers? Why is this one so special that it can only be found on the accused's truck? Of these questions, the article does not give an answer.
"I’m not saying that this your client’s vehicle,” Liscio repeated. “All I am saying is that the vehicle in question is consistent with my report, and if there is another vehicle that looks similar, that is possible.” How about at least 326 vehicles found on just two used car web sites?
If you'd like to explore these topics in depth, I'd invite you to sign up for any one (or all) of our upcoming training sessions. Our Statistics for Forensic Analysts course is offered on-line as micro learning and thus enrollment can happen at your convenience. Our other courses can be facilitated at your location or at ours, in Henderson, NV.
When the data supports no conclusion, I try to quantify why. I usually note the nominal resolution and / or the particular defect that may be getting in the way - blur, obstruction, etc. What I don't do is equivocate. Quite the opposite, I try to be very specific as to why the question can't be answered. In this way, there is no ambiguity in my conclusion(s).
Additionally, whomever is responsible for the source of the evidence will have insight as to potential improvements to the situation. For example, if the question is "what is license plate," and the camera is positioned to monitor a parking lot, then the person / company responsible for the security infrastructure can be alerted to the potential need for additional coverage in the area of interest. This could mean additional cameras, or a change in lensing, or ...
Why this topic today?
I received a link to this article in my inbox. "Expert says Merritt truck ‘cannot be excluded’ as vehicle on McStay neighborhood video." Really? "Cannot be excluded?" What does, "cannot be excluded" mean?
At issue is a 2000 Chevy work truck, similar to the one below. Chevy makes some of the most popular trucks in the US, second only to Ford. This case takes place in Southern California, home to more than 20m people from Kern to San Diego counties.

"Cannot be excluded" is not a conclusion, it's an equivocation. Search CarFax.com for used Chevy Silverado 3500 HD trucks for sale within a 100 mile radius of Fallbrook, CA (92028). I did. I found 49 trucks for sale on that site. 49 trucks that "cannot be excluded" ... AutoTrader listed 277 trucks for sale. 277 more trucks that "cannot be excluded" ...
All of this requires us to ask a question, is the goal of a comparative analysis to "exclude" or to "include?" How would you know if you've never taken a course in comparative analysis? Perhaps we can start with the SWGDE Best Practices for Photographic Comparison for All Disciplines. Version: 1.1 (July 18, 2017) (link):
Class Characteristic – A feature of an object that is common to a group of objects.
Individualizing Characteristic – A feature of an object that contributes to differentiating that object from others of its class.
5.2 Examine the photographs to determine if they are sufficient quality to complete an examination, and if the quality will have an effect on the degree to which an examination can be completed. Specific disciplines should define quality criteria, when possible, and how a failure to meet the specified quality criterion will impact results. (This may apply to a portion of the image, or the image as a whole.)
5.2.1 If the specified quality criteria are not met, determine if it is possible to obtain additional images. If the specified quality criteria are not met, and additional images cannot be obtained, this may preclude the examiner from conducting an examination, or the results of the examination may be limited.
5.3 Enhance images as necessary. Refer to ASTM Guide E2825 for Forensic Digital Image Processing.
These steps are the essence of the Content Triage step in the workflow - do I have enough nominal resolution to continue processing and reach a conclusion?
But, there is more to this process than just a comparison of a "known" and an "unknown." How does one go from "unknown" to a "known" for a comparison? How do you "know" what is "known?" First, you must attempt a Vehicle Make / Model Determination of the vehicle in the CCTV footage.
For a Vehicle Make / Model Determination, the SWGDE Vehicle Make/Model Comparison Form. Version: 1.0 (July 11, 2018) (source) is quite helpful.
How many features are shared between model years in a specific manufacturer's product line? Class Characteristics can help get you to "truck," then to "work truck" (presence of exterior cargo containers not typically present in a basic pickup truck), then to "make" based on shapes and positions of features of the items found in the Comparison form. The form can be used to document your findings.
You may get to Make, but getting to Model in low resolution images and video can be frustrating. What's the difference between a Chevy Silverado 1500, 1500LD, 2500HD, 3500HD? There are more than 10 trim variations of the 1500 series alone. What's the difference between a 2500HD and a 3500HD?
After you've documented your process of going from "object" to "work truck" to a specific model of work truck, how do you move beyond class, to make, to model, to year, to a specific truck? Remember, an Individualizing Characteristic is a feature of an object that contributes to differentiating that object from others of its class. Before you say "headlight spread pattern," please know that there is no valid research supporting "headlight spread pattern" as an individualizing characteristic - NONE. I know that there are cases where this technique has been used, but rhetoric is not science. Many jurisdictions, such as California and Georgia, will allow just about everything in at trial, so not having one's testimony excluded at trial is not proof of anything scientific.
Taking your CCTV footage, you've made your make / model / year determination using the SWGDE's form. Now, how do you move to an individual truck?
This is where basic statistics and inferential reasoning are quite necessary. Do you have sufficient nominal resolution to pick out identifying characteristics in the footage? If not, you're done. The data supports no conclusion as to individualization.
But assuming that you do, how do you work scientifically and as bias free as possible? Unpack the biasing information that you received from your "client" and design an experiment. In the US, given our Constitutional provisions that the accused are innocent until proven guilty, it is for the prosecution to prove guilt. Thus, the staring point for your experiment is that the truck in question is not a match. With sufficient nominal resolution, you set about to prove that there is a match. If you can't, there is no match as far as you're concerned. Remember, the comparative analysis should not be influenced by any other factors or items of evidence.
In designing the experiment, you'll need a sample set of images. You see, a simple "match / no match" comparison needs an adequate sample. It perverts the course of justice to simply attempt the comparison on the accused's vehicle. We don't do witness ID line-ups with just the suspect. Neither should anyone attempt a comparison with just a single "unknown" image - the accused's. Yes, I do use this specific provision of English Common Law to explain the problem here. Perverting the Course of Justice can be any of three acts, fabricating or disposing of evidence, intimidating or threatening a witness or juror, intimidating or threatening a judge. In this case, one Perverts the Course of Justice when one fabricates a conclusion (scientific evidence) where none is possible.
Back to the experiment. How many "unknown" images would you need to approach 99% confidence in your results, thus assisting the course of justice? Answer = 52. How did I come up with 52?
Exact - • Generic binomial test
Analysis: A priori: Compute required sample size
Input: Tail(s) = One
Proportion p2 = 0.8
α err prob = 0.01
Power (1-β err prob) = .99
Proportion p1 = 0.5
Output: Lower critical N = 35.0000000
Upper critical N = 35.0000000
Total sample size = 52
Actual power = 0.9901396
Actual α = 0.008766618
A generic binomial test is similar to the flip of a coin - only two possible outcomes, heads / tails or match / no match. It's the simplest test to perform.

The error probability is your chance of being wrong. At 52 test images, you've got a 1 in 100 chance of being wrong (.99). As you move below 15 test images, you have a greater chance of being wrong than being right. With a sample size of 1, you're likely more accurate tossing a coin.
The 52 samples help us to get to make / model / year. You may chose to refresh those samples with new ones to perform a "blind comparison," and attempt to "include" the suspect's vehicle in your findings. To do this, you'd need the specific description of the "known" vehicle that makes it unique vs the others in the sample.
If I were performing a make / model / year determination, and then a comparison, I would note any errors or limitations in my report. If the data supported no conclusion, or if the limitations in the data prevented me from arriving at a determination, I would note that the data supported no conclusion. If I was able to make a determination, I would have noted my process and how I arrived at the conclusion (in a reliable, valid, and reproducible fashion).
The problem with the reporting of the case is the "cannot be excluded" portion is in the headline. One has to read deeper into the article to find, "... Liscio denied (that his conclusions may have been formed to fit the bias of the prosecution, who was paying him...), and reminded McGee more than once that he had not identified the truck specifically as Merritt’s..."
Which requires another question be asked, if the analyst had not identified the vehicle, what was he doing there in testimony?
"Among the items that helped to reach the conclusion that the vehicle was “consistent” with Merritt’s truck was a glint caught by the video that matched the position of a latch on a passenger-side storage box toward the rear of the truck, said Liscio,who uses 3D imagery."
Here we move from "cannot be excluded" to "consistent with," another equivocation. How does one not identify a vehicle, but find that said unknown vehicle is "consistent with" the "known" vehicle? This is the problem with Demonstrative Comparisons. When you place a single "known" against a single "unknown" in a demonstrative exhibit, you are making a choice as to what to include in your exhibit - thus you have concluded.
Back to the demonstrative. What is it about the latch on the side of the truck that is unique? Won't all work trucks of this type have latches on their cargo containers? Why is this one so special that it can only be found on the accused's truck? Of these questions, the article does not give an answer.
"I’m not saying that this your client’s vehicle,” Liscio repeated. “All I am saying is that the vehicle in question is consistent with my report, and if there is another vehicle that looks similar, that is possible.” How about at least 326 vehicles found on just two used car web sites?
If you'd like to explore these topics in depth, I'd invite you to sign up for any one (or all) of our upcoming training sessions. Our Statistics for Forensic Analysts course is offered on-line as micro learning and thus enrollment can happen at your convenience. Our other courses can be facilitated at your location or at ours, in Henderson, NV.
Wednesday, April 3, 2019
Why do you need science?
An interesting morning's mail. Two articles released overnight deal with forensic video analysis. Two different angles on the subject.
First off, there's the "advertorial" for the LEVA / IAI certification programs in the Police Chief Magazine.
The pitch for certification was complicated by this image:

The caption for the image further complicated the message for me: "Proper training is required to accurately recover or enhance low-resolution video and images, as well as other visual complexities."
Whilst the statement is true, do you really believe that the improvements to the image happened from the left to the right? Perhaps, for editorial purposes, the image was degraded, from the original (R) to the result (L). If I'm wrong about this, I'd love to see the case notes and the specifics as to the original file. Can you imagine such a result coming from the average CCTV file? Hardly.
Next in the bin was an opinion piece in the Washington Post's Radley Balko - "Journalists need to stop enabling junk forensics." It's seemingly the rebuttal to the LEVA / IAI piece.
Balko picks up where the ProPublica series left off - an examination of the discipline in general, and Dr. Vorder Brugge of the FBI in particular. It's an opinion piece, and it's rather pointed in it's opinion of the state of the discipline. Balko, like ProPublica, has been on this for a while now (here's another Balko piece on the state of forensic science in the US).
I don't disagree with any of the referenced authors here. Not one bit. Jan and Kim are correct in that the Trier of Fact needs competent analysts working cases. Balko is correct in that the US still rather sucks at science. That we suck as science was the main reason the Obama administration created the OSAC and the reason Texas created it's licensing scheme for analysts.
Where I think I disagree with Jan and Kim is essentially a legacy of the Daubert decision. Daubert seemingly outsourced the qualification process to third parties. It gave rise to the certification mills and to industry training programs. Training to competency means different things to different organizations. For example, I've been trained to competency on the use of Amped's FIVE and Authenticate. But, none of that training included the underlying science behind how the tool is used in case work. For that, I had to go elsewhere. But, Amped Software, Inc, certified me as a user and a trainer of the tools. That (certification) was just a step in the journey to competency, not the destination.
Balko, like ProPublica, notes the problems with pattern evidence exams. Their points are valid. But, it doesn't mean that image comparison can't be accomplished. It does mean that image comparisons should be founded in science. One of those sciences is certainly image science (knowing the constituent parts of the image / video and how the evidence item was created, transmitted, stored, retrieved, etc. But another one of the sciences necessary is statistics (and experimental design).
As I noted in my letter to the editor of the Journal of Forensic Identification, experimental design and statistics form a vital part of any analysis. For pattern matching, the evidence item may match the CCTV footage. But, would a representative sample of similar items (shirts, jeans, etc) also match? Can you calculate probabilities if you're unaware of the denominator in the function (what's the population of items)? Did you calculate the sample size properly for the given test? Do you have access to a sample set? If not, did you note these limitations in your report? Did these limitations inform your conclusions?
Both LEVA and the IAI have a requirement for their certified analysts to seek and complete additional training / education towards eventual recertification. This is a good thing. But, as many of us know, there are only so many training opportunities. At some point, you kind of run out of classes to take is a common refrain. Whilst this may be true for "training" (tool / discipline specific), this is so not true for education. There are a ton of classes out there to inform one's work. The problem there becomes price / availability. This price / availability problem was the primary driver behind my taking my Statistics class out of the college context and putting it on-line as micro learning. My other classes from my "curriculum in a box" concept will roll out later this year and into the next year.
So to the point of the morning's articles - yes, you do need a trained / educated analyst. Yes, that analyst needs to engage in a scientific experiment - governed both by image science as well as experimental science. Forensic science can be science, if it's conducted scientifically. Otherwise, it becomes a rhetorical exercise utilizing demonstratives to support it's unreproducible claims.
First off, there's the "advertorial" for the LEVA / IAI certification programs in the Police Chief Magazine.
The pitch for certification was complicated by this image:

The caption for the image further complicated the message for me: "Proper training is required to accurately recover or enhance low-resolution video and images, as well as other visual complexities."
Whilst the statement is true, do you really believe that the improvements to the image happened from the left to the right? Perhaps, for editorial purposes, the image was degraded, from the original (R) to the result (L). If I'm wrong about this, I'd love to see the case notes and the specifics as to the original file. Can you imagine such a result coming from the average CCTV file? Hardly.
Next in the bin was an opinion piece in the Washington Post's Radley Balko - "Journalists need to stop enabling junk forensics." It's seemingly the rebuttal to the LEVA / IAI piece.
Balko picks up where the ProPublica series left off - an examination of the discipline in general, and Dr. Vorder Brugge of the FBI in particular. It's an opinion piece, and it's rather pointed in it's opinion of the state of the discipline. Balko, like ProPublica, has been on this for a while now (here's another Balko piece on the state of forensic science in the US).
I don't disagree with any of the referenced authors here. Not one bit. Jan and Kim are correct in that the Trier of Fact needs competent analysts working cases. Balko is correct in that the US still rather sucks at science. That we suck as science was the main reason the Obama administration created the OSAC and the reason Texas created it's licensing scheme for analysts.
Where I think I disagree with Jan and Kim is essentially a legacy of the Daubert decision. Daubert seemingly outsourced the qualification process to third parties. It gave rise to the certification mills and to industry training programs. Training to competency means different things to different organizations. For example, I've been trained to competency on the use of Amped's FIVE and Authenticate. But, none of that training included the underlying science behind how the tool is used in case work. For that, I had to go elsewhere. But, Amped Software, Inc, certified me as a user and a trainer of the tools. That (certification) was just a step in the journey to competency, not the destination.
Balko, like ProPublica, notes the problems with pattern evidence exams. Their points are valid. But, it doesn't mean that image comparison can't be accomplished. It does mean that image comparisons should be founded in science. One of those sciences is certainly image science (knowing the constituent parts of the image / video and how the evidence item was created, transmitted, stored, retrieved, etc. But another one of the sciences necessary is statistics (and experimental design).
As I noted in my letter to the editor of the Journal of Forensic Identification, experimental design and statistics form a vital part of any analysis. For pattern matching, the evidence item may match the CCTV footage. But, would a representative sample of similar items (shirts, jeans, etc) also match? Can you calculate probabilities if you're unaware of the denominator in the function (what's the population of items)? Did you calculate the sample size properly for the given test? Do you have access to a sample set? If not, did you note these limitations in your report? Did these limitations inform your conclusions?
Both LEVA and the IAI have a requirement for their certified analysts to seek and complete additional training / education towards eventual recertification. This is a good thing. But, as many of us know, there are only so many training opportunities. At some point, you kind of run out of classes to take is a common refrain. Whilst this may be true for "training" (tool / discipline specific), this is so not true for education. There are a ton of classes out there to inform one's work. The problem there becomes price / availability. This price / availability problem was the primary driver behind my taking my Statistics class out of the college context and putting it on-line as micro learning. My other classes from my "curriculum in a box" concept will roll out later this year and into the next year.
So to the point of the morning's articles - yes, you do need a trained / educated analyst. Yes, that analyst needs to engage in a scientific experiment - governed both by image science as well as experimental science. Forensic science can be science, if it's conducted scientifically. Otherwise, it becomes a rhetorical exercise utilizing demonstratives to support it's unreproducible claims.
Monday, March 4, 2019
What is Analysis?
What is analysis?
a·nal·y·sis [əˈnaləsəs] - NOUN
analyses (plural noun)
synonyms: dissection · assay · testing · breaking down · separation · reduction · decomposition · fractionation
antonyms: synthesis
Forensic science is the systematic and coherent study of traces to address questions of authentication, identification, classification, reconstruction, and evaluation for a legal context. (Source: A Framework to Harmonize Forensic Science Practices and Digital/Multimedia Evidence. OSAC Task Group on Digital/Multimedia Science. 2017)
What is a trace? A trace is any modification, subsequently observable, resulting from an event. You walk within the view of a CCTV system, you leave a trace of your presence within that system.
Thus, forensic video analysis (or forensic multimedia analysis) can be seen as a systematic and coherent examination of video (multimedia) traces (elements) to address questions of authentication, identification, classification, reconstruction, and evaluation for a legal context.
In the former definition, we can see the quantitative nature of analysis. The latter definition reveals it's potential qualitative elements.
In a quantitative data analysis, things are stable, controlled - facts can be obtained (facts are measurable / objective). In a qualitative data analysis, things are dynamic. Your role as an observer may influence the analysis. What is "true" depends on the situation & setting (truths are things we "know" - subjective). A quantitative study is controlled. A qualitative study is observed.
A qualitative study's purpose is to describe or understand something. The purpose of a quantitative study is to test, resolve, or predict something (e.g. in order to use a DVR to determine speed of an object within it's derivative video files - results will be a range of values, one must resolve how the DVR creates files "typically" through a controlled series of tests).
The analyst's viewpoint during a quantitative study is logical, empirical, deductive (conclusion guaranteed). In a qualitative study, it's situational and inductive (conclusion merely likely) or abductive (taking one's best shot). Performing a comparative analysis with convenience samples is an example of taking one's best shot. A quantitative study would feature an appropriate sample size calculation and note any limitations that arose as a result of not being able to achieve the appropriate samples.
From a contextual standpoint, a quantitative's context is not taken into consideration but rather controlled via methodological procedures. In this way, potential bias is mitigated. In a qualitative study, context matters - values, feelings, opinions, individual participants matter.
In a quantitative study, the analyst seeks to solve, to conclude, or to verify a predetermined hypothesis. With a qualitative study, the orientation changes - seeking rather to discover or explore. This can occur often in investigations - new information developed leads to changes in the direction of the investigation as things / people are ruled-in / ruled-out.
In a quantitative analysis, the inputs and results are numerical - data is in the form of numbers / numerical info. A qualitative analysis is narrative in nature - data is in the form of words, sentences, paragraphs, notes, or pictures / graphics / etc.
After conducting a quantitive analysis, one's results / findings can be generalized to other populations or situations. The results of a qualitative analysis are case specific, particular, or specialized.
With all of this in mind, what is analysis? What type of analysis are you conducting? What type of analysis are you reporting? When analyzing the work of other analysts, what type of work are they conducting / reporting?
You can use this dialog to build a template / matrix. In reviewing work, examine the elements above to determine if the work is quantitative or qualitative. For example, you're reviewing an analyst's work in on a measurement request (photogrammetry). The results section features a picture that has been marked up with arrows and text. No methodology is discussed. These results would be considered qualitative. If the results section featured a conclusion, a range of values, error estimation, and a reference / methodology section, it could be considered quantitative. You could take the analyst's data and reproduce their study - which is not possible from an annotated picture.
The elements for a quantitative analysis described above, when reported back to the Trier of Fact, help ensure that you've maintained standards compliance (ASTM E2825-18). Rhetorical or narrative statements are fine for the introductory section of your report - a summary of the request - but are not sufficient for supporting a conclusion or describing one's processes.
If you'd like to know more, join me in an upcoming training session. For more information or to sign up, click here.
a·nal·y·sis [əˈnaləsəs] - NOUN
analyses (plural noun)
- detailed examination of the elements or structure of something. "statistical analysis" · "an analysis of popular culture"
- the process of separating something into its constituent elements. Often contrasted with synthesis. "the procedure is often more accurately described as one of synthesis rather than analysis"
synonyms: dissection · assay · testing · breaking down · separation · reduction · decomposition · fractionation
antonyms: synthesis
Forensic science is the systematic and coherent study of traces to address questions of authentication, identification, classification, reconstruction, and evaluation for a legal context. (Source: A Framework to Harmonize Forensic Science Practices and Digital/Multimedia Evidence. OSAC Task Group on Digital/Multimedia Science. 2017)
What is a trace? A trace is any modification, subsequently observable, resulting from an event. You walk within the view of a CCTV system, you leave a trace of your presence within that system.
In the former definition, we can see the quantitative nature of analysis. The latter definition reveals it's potential qualitative elements.
In a quantitative data analysis, things are stable, controlled - facts can be obtained (facts are measurable / objective). In a qualitative data analysis, things are dynamic. Your role as an observer may influence the analysis. What is "true" depends on the situation & setting (truths are things we "know" - subjective). A quantitative study is controlled. A qualitative study is observed.
A qualitative study's purpose is to describe or understand something. The purpose of a quantitative study is to test, resolve, or predict something (e.g. in order to use a DVR to determine speed of an object within it's derivative video files - results will be a range of values, one must resolve how the DVR creates files "typically" through a controlled series of tests).
The analyst's viewpoint during a quantitative study is logical, empirical, deductive (conclusion guaranteed). In a qualitative study, it's situational and inductive (conclusion merely likely) or abductive (taking one's best shot). Performing a comparative analysis with convenience samples is an example of taking one's best shot. A quantitative study would feature an appropriate sample size calculation and note any limitations that arose as a result of not being able to achieve the appropriate samples.
From a contextual standpoint, a quantitative's context is not taken into consideration but rather controlled via methodological procedures. In this way, potential bias is mitigated. In a qualitative study, context matters - values, feelings, opinions, individual participants matter.
In a quantitative study, the analyst seeks to solve, to conclude, or to verify a predetermined hypothesis. With a qualitative study, the orientation changes - seeking rather to discover or explore. This can occur often in investigations - new information developed leads to changes in the direction of the investigation as things / people are ruled-in / ruled-out.
In a quantitative analysis, the inputs and results are numerical - data is in the form of numbers / numerical info. A qualitative analysis is narrative in nature - data is in the form of words, sentences, paragraphs, notes, or pictures / graphics / etc.
After conducting a quantitive analysis, one's results / findings can be generalized to other populations or situations. The results of a qualitative analysis are case specific, particular, or specialized.
With all of this in mind, what is analysis? What type of analysis are you conducting? What type of analysis are you reporting? When analyzing the work of other analysts, what type of work are they conducting / reporting?
You can use this dialog to build a template / matrix. In reviewing work, examine the elements above to determine if the work is quantitative or qualitative. For example, you're reviewing an analyst's work in on a measurement request (photogrammetry). The results section features a picture that has been marked up with arrows and text. No methodology is discussed. These results would be considered qualitative. If the results section featured a conclusion, a range of values, error estimation, and a reference / methodology section, it could be considered quantitative. You could take the analyst's data and reproduce their study - which is not possible from an annotated picture.
The elements for a quantitative analysis described above, when reported back to the Trier of Fact, help ensure that you've maintained standards compliance (ASTM E2825-18). Rhetorical or narrative statements are fine for the introductory section of your report - a summary of the request - but are not sufficient for supporting a conclusion or describing one's processes.
If you'd like to know more, join me in an upcoming training session. For more information or to sign up, click here.
Tuesday, December 18, 2018
Sample Sizes and Speed Calculations, oh my!
There's been a lot of talk lately about using the footage from a DVR to determine the speed of an object depicted on the video. In my classes on the topic, I explain how to set up the experiment to validate the results of your tests. In this post, I want to present a few snapshots of the steps in the validation.
It's been well documented that DVRs are not Swiss chronographs, they're mostly a cheap box of random parts. The on-screen time stamps have been shown to be "estimates" and "approximations" of time - not entirely reliable. It's also well documented that the files' metadata contains hints about time. Let's take a look at a few scenarios.
Test 1: Geovision

The question in this case was, is the particular evidence item reliable in it's generation of frames such that the frame rate metadata could be used for speed calculation?
A sample size calculation was performed to see how many tests would need to be performed to build a model of the DVR's performance. In this way, we'd know if the evidence item was typical of the performance of the DVR or a one-time error.


It's been well documented that DVRs are not Swiss chronographs, they're mostly a cheap box of random parts. The on-screen time stamps have been shown to be "estimates" and "approximations" of time - not entirely reliable. It's also well documented that the files' metadata contains hints about time. Let's take a look at a few scenarios.
Test 1: Geovision
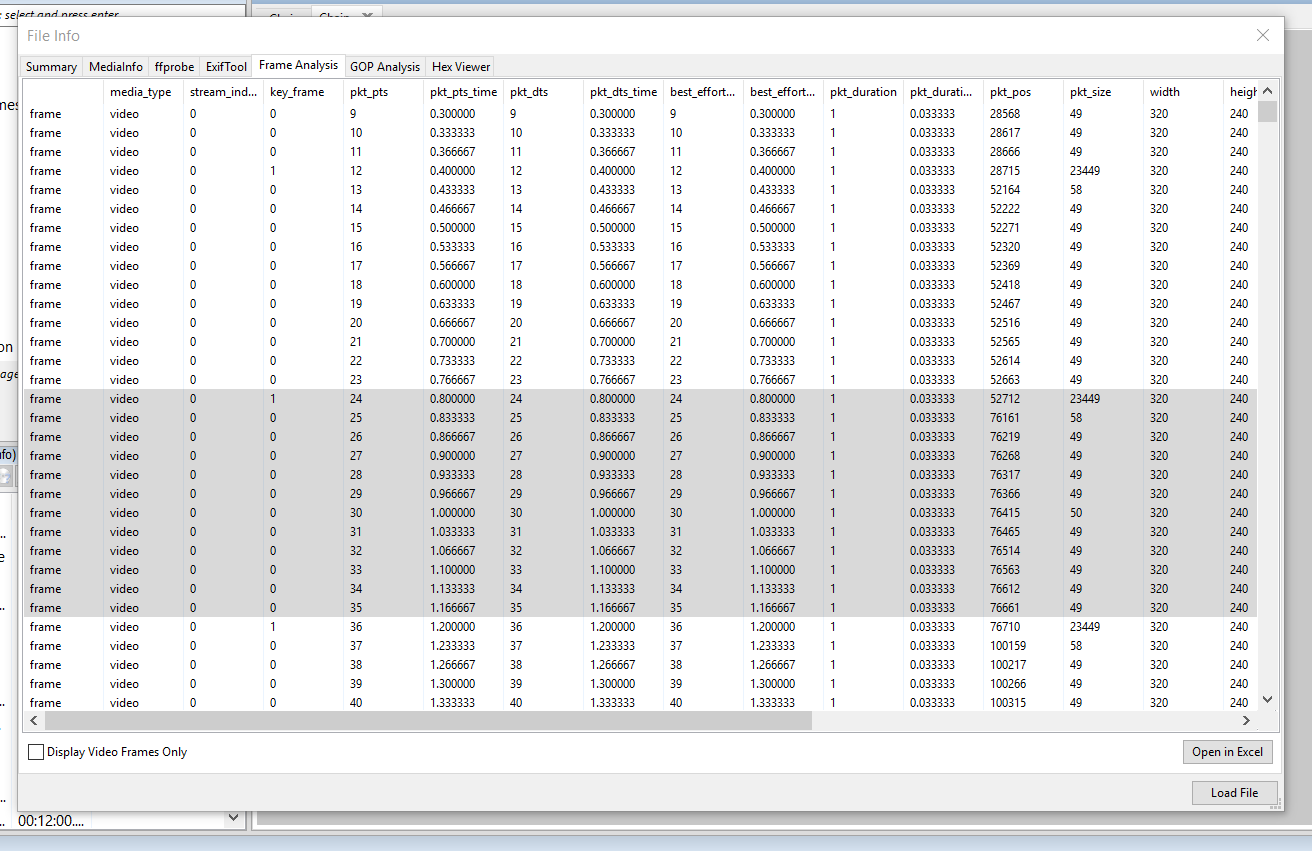
The question in this case was, is the particular evidence item reliable in it's generation of frames such that the frame rate metadata could be used for speed calculation?
A sample size calculation was performed to see how many tests would need to be performed to build a model of the DVR's performance. In this way, we'd know if the evidence item was typical of the performance of the DVR or a one-time error.

Analysis: A priori: Compute required sample size
Input: Tail(s) = One
Proportion p2 = 0.8
α err prob = 0.05
Power (1-β err prob) = 0.99
Proportion p1 = 0.5
Output: Lower critical N = 24.0000000
Upper critical N = 24.0000000
Total sample size = 37
Actual power = 0.9907227
Actual α = 0.0494359
The calculation determined that a total of 37 tests (sample size = 37) would yield the best results of our generic binomial test (works correctly / doesn't work correctly). On the other end of the graph, for a sample size less than 10, a coin flip would have been more accurate.
The Frame Analysis shown above, generated by Amped FIVE, seems to indicate that the I Frame generation is fairly regular and perhaps the P Frames are duplicates of the previous I Frame. You'd only get this information from an analysis of the metadata - plus a hash of each frame. Nothing viewed on-screen, watching the video play, would give you this specific information.
It's important to note that this one video represents one channel in a 16-channel DVR. The DVR features motion / alarm activation of it's recordings. It took a bit of digging to find out how many camera streams were active (motion / alarm) during the time the evidence item was being recorded.
With the information in hand, we created an experiment to reproduce the original recording conditions.
But first, a couple of important definitions are needed.
Observational Data: It's an observational study which they observe things in different circumstances over which the researcher has no control.
Experimental Data: It's data that is collected from an experimental study that involves taking measurements which can be controlled.
Our experiment in this case was "experimental." We were able to control which of the DVRs channels were actively recording - when and for how long.
With the 37 tests conducted and the data recorded, it was determined that the average recording rate within the DVR - for the channel that recorded the evidence item - was effectively seven seconds per frame. Essentially, the DVR was so overwhelmed with data that it could not process all of the incoming signal effectively. It did the best that it could, but in it's "error state," the I Frames were copied to fill the data container. Some I Frames were even duplicates of previous I Frames. This was likely due to a rule about the fps needed to create the piece of media - the system's native container format was .avi.
Test 2: Dahua
In a second test, a "generic" black box DVR was tested. The majority of the parts could be sourced to Dahua (China). The 16 camera system outputs a native file with a .264 extension.
The "forensic applications," FIVE included, are all based on FFMPEG for the "conversion" of these types of files. After conversion, the report of the processing indicated that the fps of the output video was 25fps. BUT, this was recorded in the US.
Is 25fps the correct rate?
Is 25fps an "error state?"
If 25fps isn't the "correct rate," what should it be?
In this case, the frame rate information in the original container was "non-standard." As such, FFMPEG had no way of identifying what "it should be" and thus defaulted to 25fps - the output container needs to know it's playback rate. Why 25fps? FFMPEG is French - where the playback rate (PAL) is 25fps.
In this case, we didn't have an on-screen timestamp to begin our work. Thus, we needed to conduct and experiment to attempt to calculate an effective frame rate for this particular DVR. This begins with a sample size calculation. How many tests do we need to build the model of the DVR's performance.

t tests - Linear multiple regression: Fixed model, single regression coefficient
Analysis: A priori: Compute required sample size
Input: Tail(s) = One
Effect size f² = 0.15
α err prob = 0.05
Power (1-β err prob) = 0.99
Number of predictors = 2
Output: Noncentrality parameter δ = 4.0062451
Critical t = 1.6596374
Df = 104
Total sample size = 107
Actual power = 0.9902320
In order to control for all of the points of data entry into the system (16 channels) as well as data choke points (chips and busses), our sample size has increased quite significantly. It's not a simple yes/no test as in Test 1 (above).
A multiple linear regression attempts to model the relationship between two or more explanatory variables and a response variable by fitting a linear equation to observed data. Essentially, how do the channels, busses, and chips (independent / control variables) influence the resulting data container (dependent variable)?
The tests were run and the data assembled. It was found that the effective frame rate of the channel that recorded our evidence was 1.3526fps. If you had just accepted the 25fps given to you by FFMPEG, the display of the video would have been inaccurate. Using the 25fps for the speed calculation would also yield inaccurate results. Having the effective frame rate, plus the validation of the results, helps the entire process trust your results.
It certainly helps that my tool of choice in working with the video data, Amped FIVE, contains the tools necessary to analyse the data. I can hash each frame (hash is now part of the Inspector Tools in FIVE). I can analyse the metadata (see above). Plus, I can adjust the playback rate precisely (Change Frame Rate filter).

These examples illustrate the distinct difference between what one "knows" and what one can "prove." We can "know" what the data stream tells us via the various frame analysis tools that are available. We can "prove" the validity of our results by conducting the appropriate tests, utilizing the appropriate number of tests (sample size).
If you are interested in knowing more about this topic, or if you need help on a case, or if you'd like to learn how to do these tests yourself, you can find out more by clicking here.
Subscribe to:
Posts (Atom)